This is best Fabric, Power BI, SQL and AI community event. How do we know? The last event sold out! Save €200 with code FABCMTY200.
Register nowJuly 28 - August 9 | Final Round of the Power BI Dataviz World Championships. This is your chance. Learn more
Hi I'm new in Power Bi. I just windering that the KPI Indicator Visualization can be set the range for KPI Color or not?
and how can it know that which value should be in which color?
Thank you very much.
Hi @iNuii,
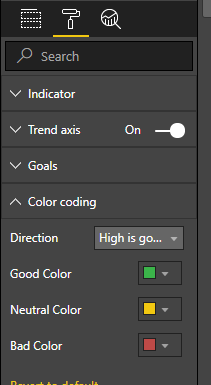
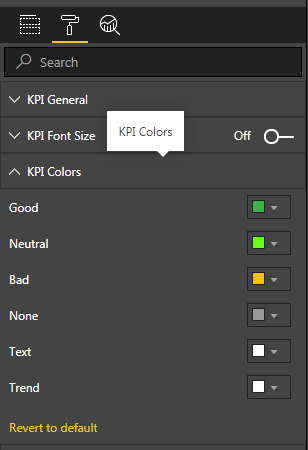
You can set the color for KPI indicator under format pane.
If "Indiator" value meets the "Target" value, it is formatted with "Good Color". Otherwise, it is formatted with "Bad" color.
Regards,
Yuliana Gu
@v-yulgu-msft Thank you for your reply,
but I wanna know that the KPI Customs Visualization (KPI Indicator) can be set the range / critiria for value or not?
Thank you in advance
Hi @iNuii,
but I wanna know that the KPI Customs Visualization (KPI Indicator) can be set the range / critiria for value or not?
No. This is not supported now. The conditional colors in KPI Indicator works the same way as the built-in KPI visual.
Regards,
Yuliana Gu
Join us in Barcelona for FabCon and SQLCon, the Fabric, Power BI, SQL, and AI community event. Save €200 with code FABCMTY200.
| User | Count |
|---|---|
| 27 | |
| 22 | |
| 20 | |
| 18 | |
| 14 |
| User | Count |
|---|---|
| 23 | |
| 20 | |
| 20 | |
| 20 | |
| 20 |