cancel
Showing results for 
Search instead for 
Did you mean: 

The Fabric community is now in read-only for platform upgrade. Learn more

Reply
rajendraongole1
Super User
Super User

Matrix visualization total value, Quarter split

Dear All,


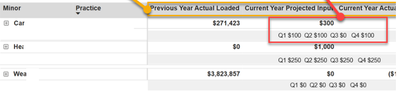
I have prepared a matrix visualization with hirarchy where total values are reporting perfectly fine,. but here i got to report for some of the values with quarterly result/output split as shown below image: 


rajendraongole1_0-1709890536708.png

Example: Current year projected input value is 300, need to split Quarterly as shown.

please support to acheive this.


Did I answer your question? Mark my post as a solution!

Proud to be a Super User!


1 REPLY 1
Anonymous
Not applicable

Hi @rajendraongole1 


You need to add hierarchy to columns of matrix too, like Year - Quarter.


In addition, are the "Current Year Projected Input", "Previous Year Actual Loaded" measures or columns? Does the quarterly data already exist in the data table? Or do we need to compute the quarterly data according to some specific logic?


Best Regards,
Jing


Helpful resources

Announcements
FabCon and SQLCon Barcelona 2026

FabCon & SQLCon – Barcelona 2026

Join us in Barcelona for FabCon and SQLCon, the Fabric, Power BI, SQL, and AI community event. Save €200 with code FABCMTY200.

Power BI DataViz World Championships carousel

Power BI DataViz World Championships - June 2026

A new Power BI DataViz World Championship is coming this June! Don't miss out on submitting your entry.