Get certified for free when you join Fabric Data Days 2026 and dive into Fabric, Power BI, SQL, AI, and other essential data skills.
Join nowJuly 28 - August 9 | Final Round of the Power BI Dataviz World Championships. This is your chance. Learn more
Dear All,
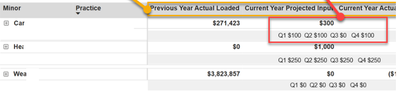
I have prepared a matrix visualization with hirarchy where total values are reporting perfectly fine,. but here i got to report for some of the values with quarterly result/output split as shown below image:
Example: Current year projected input value is 300, need to split Quarterly as shown.
please support to acheive this.
Proud to be a Super User! | |
You need to add hierarchy to columns of matrix too, like Year - Quarter.
In addition, are the "Current Year Projected Input", "Previous Year Actual Loaded" measures or columns? Does the quarterly data already exist in the data table? Or do we need to compute the quarterly data according to some specific logic?
Best Regards,
Jing
Join us in Barcelona for FabCon and SQLCon, the Fabric, Power BI, SQL, and AI community event. Save €200 with code FABCMTY200.
If you love stickers, then you will definitely want to check out our community sticker challenge, Barcelona edition!
Check out the July 2026 Power BI update to learn about new features.
| User | Count |
|---|---|
| 30 | |
| 28 | |
| 25 | |
| 24 | |
| 16 |
| User | Count |
|---|---|
| 45 | |
| 32 | |
| 17 | |
| 16 | |
| 16 |