
Get certified for free when you join Fabric Data Days 2026 and dive into Fabric, Power BI, SQL, AI, and other essential data skills.
Join nowJuly 7 - July 17 | Round 2 of the Power BI Dataviz World Championships. Don't miss your chance! Learn more
Hi im having a KPI problem here i've checked several posts but couldn't be able to solve my problems.
Objective: Shows YTD average of the KPI. The correct value should be:
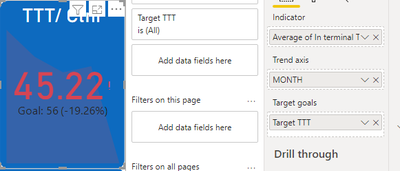
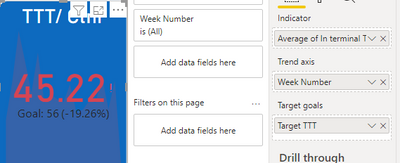
But the I change it to KPI visual, it shows only the amount of the performance last week.
Seems like if no matter if its Month or by Week.
The data is from a Excel file, month looks like this, from month 1 - 5. Week number in the same way.
The problem should be: what should I put in Trend axis in order to show YTD value?
Appreciate your help!
Solved! Go to Solution.
Hi !
Seems like you are using KPI viusal. It has a problem, when you plot this against Date dimension or any member or Date Dimension it will show the Last Member Value of that element.
Meanining if you plot it against Months, So it will show the KPI value for the month which is been last in the current context.
To overcome this you can overlay 2 objects, 1 with Year so it will give you yearly YTD KPI value, and other with month to show monthly trend. For Yearly one you can turn off the trend axis, For Monthly one you can hide the KPI value.
Hi !
Seems like you are using KPI viusal. It has a problem, when you plot this against Date dimension or any member or Date Dimension it will show the Last Member Value of that element.
Meanining if you plot it against Months, So it will show the KPI value for the month which is been last in the current context.
To overcome this you can overlay 2 objects, 1 with Year so it will give you yearly YTD KPI value, and other with month to show monthly trend. For Yearly one you can turn off the trend axis, For Monthly one you can hide the KPI value.
Join us in Barcelona for FabCon and SQLCon, the Fabric, Power BI, SQL, and AI community event. Save €200 with code FABCMTY200.
Join Data Days 2026: 60 days of free live/on-demand sessions, challenges, study groups, and certification opportunities.
| User | Count |
|---|---|
| 29 | |
| 28 | |
| 27 | |
| 26 | |
| 19 |
| User | Count |
|---|---|
| 56 | |
| 48 | |
| 39 | |
| 28 | |
| 21 |