cancel
Showing results for 
Search instead for 
Did you mean: 

July 28 - August 9 | Final Round of the Power BI Dataviz World Championships. This is your chance. Learn more

Reply
Anonymous
Not applicable

Incremental/Accumulative DAX/Query Calculation

Hi Power BI gurus!

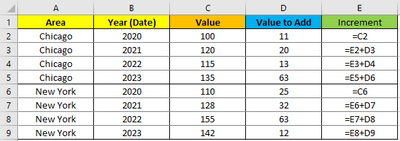
I'm struggling with getting the incremental or accumulative formula over the years. Namely, my data has Area column, Date (Year) column, Value and Value to be Added. What I need is when I dynamically select years to show on my chart or table, use the first year's Value and then for each of the following years, keep adding the Value to Add to the previous calculation. This needs to be separate for each Area and not accumulated by Year. Below is the sample of the dataset.


rakkadd_0-1645438876735.png


Appreciate any assistance! Thanks much!


1 ACCEPTED SOLUTION
amitchandak
Super User
Super User

@Anonymous , A new column


new column =
var _min = minx(filter(Table, [Area] = earlier([Area]) ), Table[Year])
var _minval = sumx(filter(Table, [Area] = earlier([Area]) && Table[Year] =_min ), Table[Value])
return
sumx(filter(Table, [Area] = earlier([Area]) && Table[Year] >=_min && Table[Year] <= earlier(Table[Year]) ), Table[Value]) + _minval


A new measure


new measure =
var _min = minx(filter(allselected(Table), [Area] = max([Area]) ), Table[Year])
var _minval = sumx(filter(allselected(Table), [Area] = max([Area]) && Table[Year] =_min ), Table[Value])
return
sumx(filter(allselected(Table), [Area] = max([Area]) && Table[Year] >=_min && Table[Year] <= max(Table[Year]) ), Table[Value]) + _minval

Share with Power BI Enthusiasts: Full Power BI Video (20 Hours) YouTube
Microsoft Fabric Series 60+ Videos YouTube
Microsoft Fabric Hindi End to End YouTube

View solution in original post

3 REPLIES 3
Anonymous
Not applicable

Hi @Anonymous ,

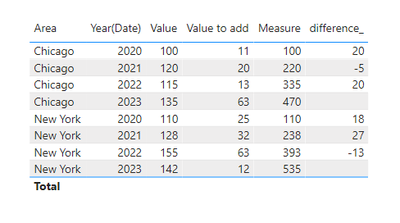
Please refer to my pbix to see if it helps you.

Create measures.


Measure = CALCULATE(SUM('Table'[Value]),FILTER(ALL('Table'),'Table'[Year(Date)]<=SELECTEDVALUE('Table'[Year(Date)])&&'Table'[Area]=SELECTEDVALUE('Table'[Area])))
difference_ =
VAR next_value =
    CALCULATE (
        MAX ( 'Table'[Value] ),
        FILTER (
            ALL ( 'Table' ),
            'Table'[Area] = SELECTEDVALUE ( 'Table'[Area] )
                && 'Table'[Year(Date)]
                    = SELECTEDVALUE ( 'Table'[Year(Date)] ) + 1
        )
    )
VAR this_value =
    MAX ( 'Table'[Value] )
VAR _a =
    CALCULATE (
        next_value - this_value,
        FILTER ( ALL ( 'Table' ), 'Table'[Area] = SELECTEDVALUE ( 'Table'[Area] ) )
    )
RETURN
    IF ( next_value = BLANK (), BLANK (), _a )


vpollymsft_0-1645679488577.png

If I have misunderstood your meaning, please provide more details about your desired output.


Best Regards

Community Support Team _ Polly


If this post helps, then please consider Accept it as the solution to help the other members find it more quickly.


amitchandak
Super User
Super User

@Anonymous , A new column


new column =
var _min = minx(filter(Table, [Area] = earlier([Area]) ), Table[Year])
var _minval = sumx(filter(Table, [Area] = earlier([Area]) && Table[Year] =_min ), Table[Value])
return
sumx(filter(Table, [Area] = earlier([Area]) && Table[Year] >=_min && Table[Year] <= earlier(Table[Year]) ), Table[Value]) + _minval


A new measure


new measure =
var _min = minx(filter(allselected(Table), [Area] = max([Area]) ), Table[Year])
var _minval = sumx(filter(allselected(Table), [Area] = max([Area]) && Table[Year] =_min ), Table[Value])
return
sumx(filter(allselected(Table), [Area] = max([Area]) && Table[Year] >=_min && Table[Year] <= max(Table[Year]) ), Table[Value]) + _minval

Share with Power BI Enthusiasts: Full Power BI Video (20 Hours) YouTube
Microsoft Fabric Series 60+ Videos YouTube
Microsoft Fabric Hindi End to End YouTube
Anonymous
Not applicable

Hi @amitchandak. Thanks for your reply.

I got it to work with slight changes. Thanks much for the setup!


Btw, how would I summarize these calculations on a year level, and provide year-over-year variance of those sums?


Helpful resources

Announcements
Fabric Community Sticker Design Challenge Barcelona Carousel

Fabric Community Sticker Challenge - Barcelona 2026

If you love stickers, then you will definitely want to check out our community sticker challenge, Barcelona edition!

July Power BI Update Carousel

Power BI Monthly Update - July 2026

Check out the July 2026 Power BI update to learn about new features.

Power BI DataViz World Championships carousel

Power BI DataViz World Championships - June 2026

A new Power BI DataViz World Championship is coming this June! Don't miss out on submitting your entry.

Top Solution Authors