Get certified for free when you join Fabric Data Days 2026 and dive into Fabric, Power BI, SQL, AI, and other essential data skills.
Join nowJuly 7 - July 17 | Round 2 of the Power BI Dataviz World Championships. Don't miss your chance! Learn more
Hello everyone,
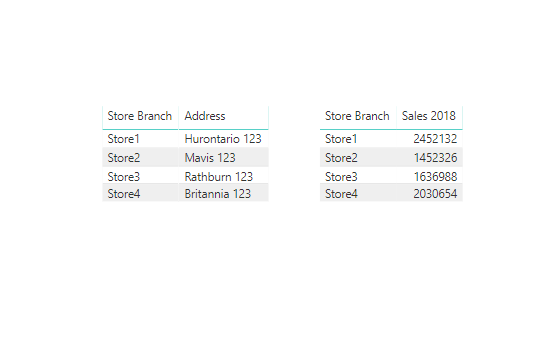
I have two differents visualizations. In one of them (table) I have this column
STORES
Store1
Store2
Store3
Store4
In the other visualization (bar chart) i have the sales from last year for these 4 stores
I want the bar chart to display all the other stores but the selected one on the first visualization.
Example: Is I select "Store2" in the first table, I would be able to see information in the bar chart only for Store1, Store3 and Store4.
Is it possible?
Thank you!
Solved! Go to Solution.
You may create a slicer table and use it as slicer.Then create a measure like below.Attached the sample file for reference.
Sales 2018 =
CALCULATE (
SUM ( Table1[Sales] ),
FILTER (
Table1,
Table1[Year] = 2018
&& Table1[Store Branch] <> SELECTEDVALUE ( 'Table'[Store Branch] )
)
)
Regards,
Cherie
You may create a slicer table and use it as slicer.Then create a measure like below.Attached the sample file for reference.
Sales 2018 =
CALCULATE (
SUM ( Table1[Sales] ),
FILTER (
Table1,
Table1[Year] = 2018
&& Table1[Store Branch] <> SELECTEDVALUE ( 'Table'[Store Branch] )
)
)
Regards,
Cherie
Hello @javiernavarro,
this is possible, can you post a sample of your dataset?
Thank you.
Did I answer your question correctly? Mark my answer as a solution!
Proud to be a Datanaut!
Thanks Livio
I want the bar chart to highlight the other rows, not the selected one.
Thanks again
Join us in Barcelona for FabCon and SQLCon, the Fabric, Power BI, SQL, and AI community event. Save €200 with code FABCMTY200.
Join Data Days 2026: 60 days of free live/on-demand sessions, challenges, study groups, and certification opportunities.
| User | Count |
|---|---|
| 28 | |
| 27 | |
| 25 | |
| 23 | |
| 17 |
| User | Count |
|---|---|
| 53 | |
| 46 | |
| 38 | |
| 30 | |
| 21 |