Get certified for free when you join Fabric Data Days 2026 and dive into Fabric, Power BI, SQL, AI, and other essential data skills.
Join nowJuly 7 - July 17 | Round 2 of the Power BI Dataviz World Championships. Don't miss your chance! Learn more
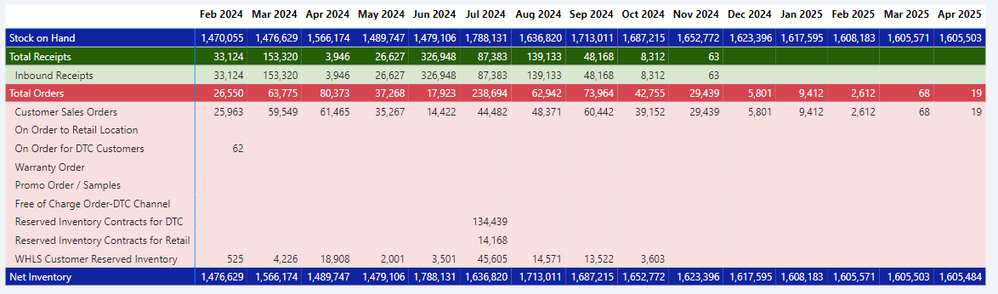
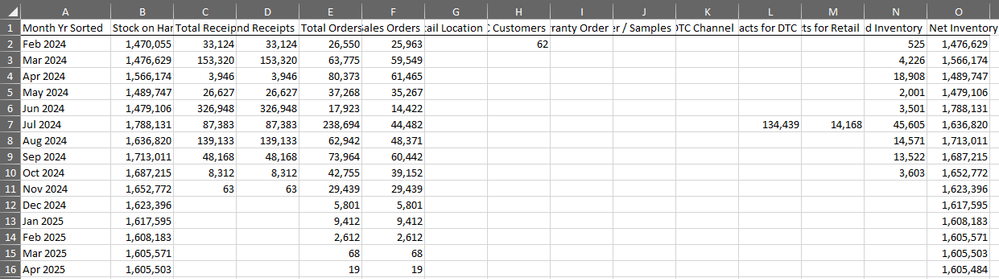
I have a matrix in a Power BI report, shown below, where values are in rows and months are in columns. I want this to export to Excel in the Exact same format, with values on rows and months on columns. However, when I export to .xlsx, either Data with Current Layout or Summarized data, the Excel report is produced with values on columns and months on rows (see second screenshot below). How can this be adjusted so I can export the file with values on rows? Thank you
@Anonymous did you find any solution to that problem?
You can correct this by not exporting. Instead, use Analyze in Excel or "Excel with Live Connection" and then recreate the desired format in Excel.
Thank you for the reply. This is a report a bunch of business users will be referencing, so I'd rather not have them need to reformat. Do you know of another matrix visual that allows for formatted exports?
Consider using Paginated Reports. Fair warning: steep learning curve.
Join us in Barcelona for FabCon and SQLCon, the Fabric, Power BI, SQL, and AI community event. Save €200 with code FABCMTY200.
Join Data Days 2026: 60 days of free live/on-demand sessions, challenges, study groups, and certification opportunities.
| User | Count |
|---|---|
| 26 | |
| 23 | |
| 19 | |
| 18 | |
| 15 |
| User | Count |
|---|---|
| 47 | |
| 44 | |
| 43 | |
| 35 | |
| 31 |