Get certified for free when you join Fabric Data Days 2026 and dive into Fabric, Power BI, SQL, AI, and other essential data skills.
Join nowJuly 28 - August 9 | Final Round of the Power BI Dataviz World Championships. This is your chance. Learn more
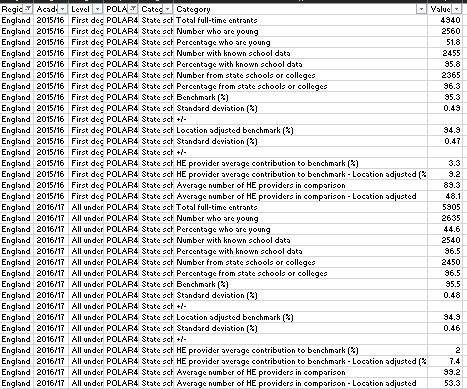
Hello, I wonder if anyone could advise on how best to start transforming this data for analysis/presentation in a pivot or matrix table:
I am struggling with the category/value columns. Do I need to unpivot the category column (I did try this but it didn't seem to help)?
Many thanks,
A
Solved! Go to Solution.
Thanks to your link @amitchandak I discovered it's pivot I need on category column, not unpivot! I am a step closer, thank you.
@adavid999 , if there are not too many values then you should unpivot. What is the problem you are getting.
If this does not help
https://radacad.com/pivot-and-unpivot-with-power-bi
Refer if these can help
https://docs.microsoft.com/en-us/powerquery-m/table-unpivot
https://community.powerbi.com/t5/Desktop/need-help-with-M-query-to-unpivot/td-p/196255
Thanks to your link @amitchandak I discovered it's pivot I need on category column, not unpivot! I am a step closer, thank you.
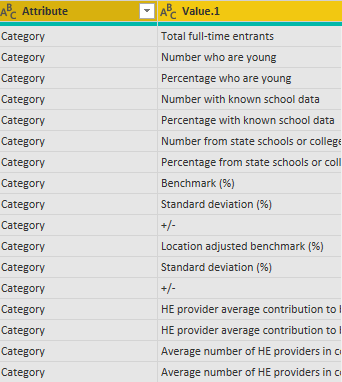
Thanks @amitchandak do you mean unpivot on the category and value column (there are not too many categories - 17). When i try this I don't get the results I expect. I will look at the links you sent, thank you.
Sorry @Greg_Deckler yes, I sent that in desperation after staring at it for hours....I would like the category repeating items to be columns and region/year/level/POLAR/category etc to be filters or nested row labels.
Cheers,
A
If you love stickers, then you will definitely want to check out our community sticker challenge, Barcelona edition!
Check out the July 2026 Power BI update to learn about new features.
| User | Count |
|---|---|
| 28 | |
| 28 | |
| 20 | |
| 19 | |
| 19 |
| User | Count |
|---|---|
| 40 | |
| 31 | |
| 18 | |
| 18 | |
| 15 |