Get certified for free when you join Fabric Data Days 2026 and dive into Fabric, Power BI, SQL, AI, and other essential data skills.
Join nowJuly 28 - August 9 | Final Round of the Power BI Dataviz World Championships. This is your chance. Learn more
I have a column "Status" that contains values "completed" and "not completed"
I have a due date column
Task | Status | Due Date |
| 1 | Completed | mm/dd/yyy |
| 2 | Completed | mm/dd/yyy |
| 3 | Not Completed | mm/dd/yyy |
I want to visualize sum of all tasks completed/ sum of all tasks due for that month
I've written this query that has too many arguments
Solved! Go to Solution.
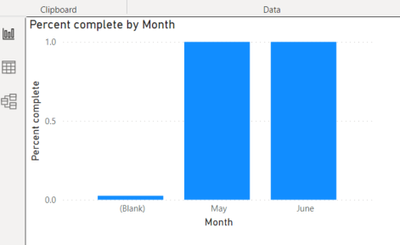
Thank you. The query seems to work, but I am unable to visualize it by due date
@SMisquith
Try this measure please:
Measure =
DIVIDE(
CALCULATE(
COUNTROWS(Table1),
Table1[Status] = "Completed"
),
COUNTROWS(Table1)
)
⭕ Subscribe and learn Power BI from these videos
⚪ Website ⚪ LinkedIn ⚪ PBI User Group
Thank you. The query seems to work, but I am unable to visualize it by due date
If you love stickers, then you will definitely want to check out our community sticker challenge, Barcelona edition!
Check out the July 2026 Power BI update to learn about new features.
| User | Count |
|---|---|
| 29 | |
| 28 | |
| 20 | |
| 20 | |
| 19 |
| User | Count |
|---|---|
| 35 | |
| 28 | |
| 20 | |
| 18 | |
| 17 |