This is best Fabric, Power BI, SQL and AI community event. How do we know? The last event sold out! Save €200 with code FABCMTY200.
Register nowThe Fabric community is now in read-only for platform upgrade. Learn more
I have a column "Status" that contains values "completed" and "not completed"
I have a due date column
Task | Status | Due Date |
| 1 | Completed | mm/dd/yyy |
| 2 | Completed | mm/dd/yyy |
| 3 | Not Completed | mm/dd/yyy |
I want to visualize sum of all tasks completed/ sum of all tasks due for that month
I've written this query that has too many arguments
Solved! Go to Solution.
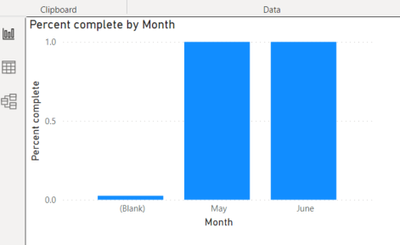
Thank you. The query seems to work, but I am unable to visualize it by due date
@SMisquith
Try this measure please:
Measure =
DIVIDE(
CALCULATE(
COUNTROWS(Table1),
Table1[Status] = "Completed"
),
COUNTROWS(Table1)
)
⭕ Subscribe and learn Power BI from these videos
⚪ Website ⚪ LinkedIn ⚪ PBI User Group
Thank you. The query seems to work, but I am unable to visualize it by due date
Join us in Barcelona for FabCon and SQLCon, the Fabric, Power BI, SQL, and AI community event. Save €200 with code FABCMTY200.
| User | Count |
|---|---|
| 21 | |
| 21 | |
| 14 | |
| 14 | |
| 13 |
| User | Count |
|---|---|
| 47 | |
| 35 | |
| 24 | |
| 20 | |
| 19 |