cancel
Showing results for 
Search instead for 
Did you mean: 

July 28 - August 9 | Final Round of the Power BI Dataviz World Championships. This is your chance. Learn more

Reply
emman_burgonia
Frequent Visitor

Creating a Matrix Table from Different Columns

Hi everyone, 


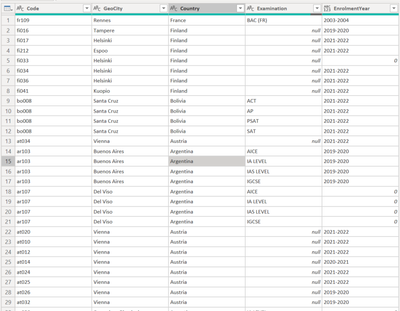
I am still pretty new in Power BI but I am having trouble creating a matrix visualization based on this table:

emman_burgonia_0-1663342484934.png

The idea should look like this

emman_burgonia_1-1663342632248.png

I was able to extract the years however I cannot add the count of codes for the columns. Can you help me figure out the possible solution for this? 

1 ACCEPTED SOLUTION
Coriel-11
Resolver II
Resolver II

In the "Rows" box drag the "Geocity" field

In the "Columns" box put the "EnrolementYear" field

In the "Values" box put the "Code" BUT then right click on it and choose "Count".


Apologies if that's what you've already tried. If so, perhaps you could explain a little more or provide some sample data.

View solution in original post

4 REPLIES 4
Coriel-11
Resolver II
Resolver II

In the "Rows" box drag the "Geocity" field

In the "Columns" box put the "EnrolementYear" field

In the "Values" box put the "Code" BUT then right click on it and choose "Count".


Apologies if that's what you've already tried. If so, perhaps you could explain a little more or provide some sample data.

emman_burgonia
Frequent Visitor

Hi @PijushRoy 


Here's the sample data

CodeGeoCityEnrolmentYear

fr109Rennes2003-2004
fi016Tampere2019-2020
fi017Helsinki2021-2022
fi212Espoo2021-2022
fi033Helsinki0
fi034Helsinki2021-2022
fi036Helsinki2021-2022
fi041Kuopio2021-2022
bo008Santa Cruz2021-2022
at034Vienna2021-2022
ar103Buenos Aires2019-2020
JorgePinho
Solution Sage
Solution Sage

If you want to display the number of codes by city and year you can do this:


Add the year field to the Columns and the city field in the Rows. Then in the Values you can add DAX measure like this:

Count_of_code = COUNTROWS(Code)

PijushRoy
Community Champion
Community Champion

Hi @emman_burgonia 


Please share (copy and paste) sample data 


Did I answer your question? Mark my post as a solution!
Appreciate your Like/Kudos

Proud to be a Super User!


Helpful resources

Announcements
FabCon and SQLCon Barcelona 2026

FabCon & SQLCon – Barcelona 2026

Join us in Barcelona for FabCon and SQLCon, the Fabric, Power BI, SQL, and AI community event. Save €200 with code FABCMTY200.

Fabric Community Sticker Design Challenge Barcelona Carousel

Fabric Community Sticker Challenge - Barcelona 2026

If you love stickers, then you will definitely want to check out our community sticker challenge, Barcelona edition!

July Power BI Update Carousel

Power BI Monthly Update - July 2026

Check out the July 2026 Power BI update to learn about new features.

Power BI DataViz World Championships carousel

Power BI DataViz World Championships - June 2026

A new Power BI DataViz World Championship is coming this June! Don't miss out on submitting your entry.