Hi there
My customer would like to select a Customer and then display 4 summary values from different tables in the same hierarchy. I've written measures for these and a very simle function that returns the relevant measure depending on the selected axis element. When I display the results in a matrix or a scatterchart, it works. However, when I apply the same data to a bar chart, two of the measures are not being displayed.
In a previous version of my model this worked perfectly. Since then I've added another couple of reference tables and it broke. I've tried to disassemble it to no avail. I did, however, have to change the relationship direction to Both.
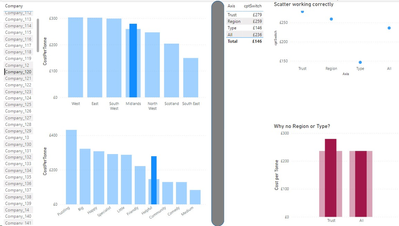
On selecting the company on the left, the visuals on the right of the grey bar display the measures. The matrix and scatter are correct but Region & Type are missing from the bar chart.
These are the measures:
1. CostPerTonne = calculate(sum('SiteYear Treatment'[Cost])/sum('SiteYear Treatment'[Weight]),'SiteYear Treatment'[Weight]<>0)
2. cptRegion = CALCULATE([CostPerTonne], ALLEXCEPT(TrustYear,TrustYear[FY]), 'Commissioning Region'[CommissioningRegion_ID]= SELECTEDVALUE('Commissioning Region'[CommissioningRegion_ID]))
3. cptType = CALCULATE([CostPerTonne], ALLEXCEPT(TrustYear,TrustYear[FY]), TrustType[TrustType_ID]=SELECTEDVALUE(TrustType[TrustType_ID]))
4. cptAll = CALCULATE([CostPerTonne], ALLEXCEPT(TrustYear,TrustYear[FY]))
and this is the 'switch' measure:
cptSwitch =
var _v = max(cptComaprisonTable[Axis])
return
if( _v="Trust", [CostPerTonne],
if( _v="Region", [cptRegion],
if( _v="Type", [cptType],
if( _v="All", [cptAll], 5
))))
I'd be so grateful for any suggestions or pointing me in the right direction.
Many thanks


