This is best Fabric, Power BI, SQL and AI community event. How do we know? The last event sold out! Save €200 with code FABCMTY200.
Register nowThe Fabric community is upgrading! Read all of the details including the timeline and what you can expect. Learn more
Hello everyone,
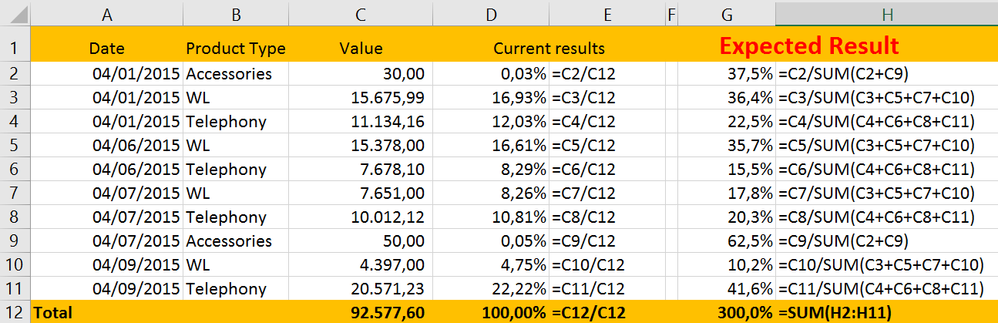
need to get the percentage value that represents each day within the month by product type using dax formula(s). E.g.:
Sample:
| Date | Product Type | Value |
| 04/01/2015 | Accessories | 30,00 |
| 04/01/2015 | WL | 15.675,99 |
| 04/01/2015 | Telephony | 11.134,16 |
| 04/06/2015 | WL | 15.378,00 |
| 04/06/2015 | Telephony | 7.678,10 |
| 04/07/2015 | WL | 7.651,00 |
| 04/07/2015 | Telephony | 10.012,12 |
| 04/07/2015 | Accessories | 50,00 |
| 04/09/2015 | WL | 4.397,00 |
| 04/09/2015 | Telephony | 20.571,23 |
| Total | 92.577,60 |
I hope I have been clear in my problem. Thank you for your attention.
Solved! Go to Solution.
Hi Paulompm,
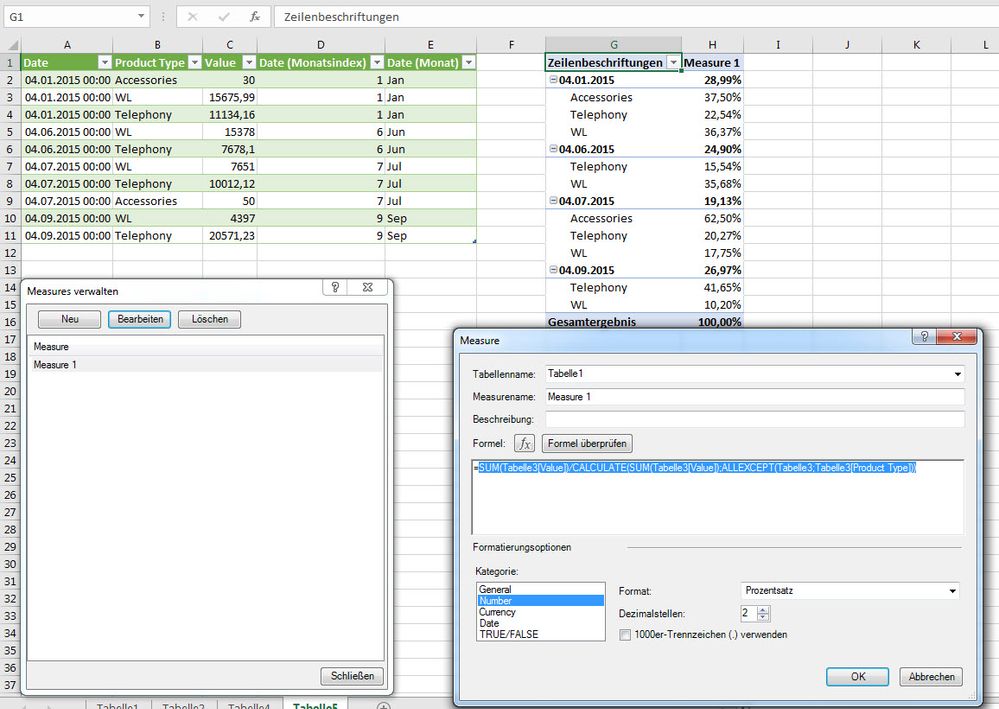
I think this measure would give you your result you wish to have.
Hi, try with this:
%ByDay =
SUMX (
Table1,
DIVIDE (
CALCULATE ( SUM ( Table1[Value] ) ),
CALCULATE ( SUM ( Table1[Value] ), ALLEXCEPT ( Table1,Table1[Product Type] ) )
)
)
Hi, try with this:
%ByDay =
SUMX (
Table1,
DIVIDE (
CALCULATE ( SUM ( Table1[Value] ) ),
CALCULATE ( SUM ( Table1[Value] ), ALLEXCEPT ( Table1,Table1[Product Type] ) )
)
)
Hi Paulompm,
I think this measure would give you your result you wish to have.
actually it isn't working very well this measure. I have data for several years and I think the ALLEXCEPT Is mixing the years or month or both. I should get much higher percentage values.
Join us in Barcelona for FabCon and SQLCon, the Fabric, Power BI, SQL, and AI community event. Save €200 with code FABCMTY200.
| User | Count |
|---|---|
| 24 | |
| 22 | |
| 19 | |
| 17 | |
| 14 |
| User | Count |
|---|---|
| 44 | |
| 36 | |
| 23 | |
| 20 | |
| 20 |