Get certified for free when you join Fabric Data Days 2026 and dive into Fabric, Power BI, SQL, AI, and other essential data skills.
Join nowJuly 28 - August 9 | Final Round of the Power BI Dataviz World Championships. This is your chance. Learn more
Hello,
I have the following measure:
Total SA WIP > 2 days =
CALCULATE(COUNTROWS('Service Appointment'),
'Service Appointment'[IsWIP]=1,
'Service Appointment'[WIP Days] >2)
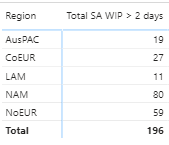
Which looks like this when added to my matrix:
I have a requirement to apply conditional formatting, but, the rag threshold will change depending on the Region.
For all regions except NAM, the rag groups will be '> 50' (red), '10 - 50' (amber) and '< 10' (green)
For NAM, the rag groups will be '> 150' (red), '30 - 150' (amber) and '< 30' (green)
How can I achieve this?
Solved! Go to Solution.
@JimJim , Create a color measure as the given example and use it in conditional format with the field value option
Color?
switch ( true(),
FIRSTNONBLANK('Table'[commodity],"NA") á"commodity1" && sum('Table'[Value]) >500,"lightgreen",
FIRSTNONBLANK('Table'[commodity],"NA") á"commodity2" && sum('Table'[Value]) >1000,"lightgreen",
Add more conditions
"Nice stay"
)
reference: https://radacad.com/dax-and-conditional-formatting-better-together-find-the-biggest-and-smallest-num...
https://docs.microsoft.com/en-us/power-bi/desktop-conditional-table-formatting#color-by-color-values
Just in case anyone is interested, here is the finished measure:
Colour =
IF (
FIRSTNONBLANK ( Location[Region], "NA" ) = "NAM",
SWITCH (
TRUE (),
'Key Measures'[Total SA WIP > 2 days] < 30, "lightgreen",
'Key Measures'[Total SA WIP > 2 days] <= 150, "orange",
"red"
),
SWITCH (
TRUE (),
'Key Measures'[Total SA WIP > 2 days] < 10, "lightgreen",
'Key Measures'[Total SA WIP > 2 days] <= 50, "orange",
"red"
)
)
@JimJim , Create a color measure as the given example and use it in conditional format with the field value option
Color?
switch ( true(),
FIRSTNONBLANK('Table'[commodity],"NA") á"commodity1" && sum('Table'[Value]) >500,"lightgreen",
FIRSTNONBLANK('Table'[commodity],"NA") á"commodity2" && sum('Table'[Value]) >1000,"lightgreen",
Add more conditions
"Nice stay"
)
reference: https://radacad.com/dax-and-conditional-formatting-better-together-find-the-biggest-and-smallest-num...
https://docs.microsoft.com/en-us/power-bi/desktop-conditional-table-formatting#color-by-color-values
If you love stickers, then you will definitely want to check out our community sticker challenge, Barcelona edition!
Check out the July 2026 Power BI update to learn about new features.
| User | Count |
|---|---|
| 30 | |
| 28 | |
| 23 | |
| 21 | |
| 19 |
| User | Count |
|---|---|
| 39 | |
| 31 | |
| 18 | |
| 17 | |
| 15 |