cancel
Showing results for 
Search instead for 
Did you mean: 

July 7 - July 17 | Round 2 of the Power BI Dataviz World Championships. Don't miss your chance! Learn more

Reply
Anonymous
Not applicable

Conditional Formatting Scatter Chart

Hi,


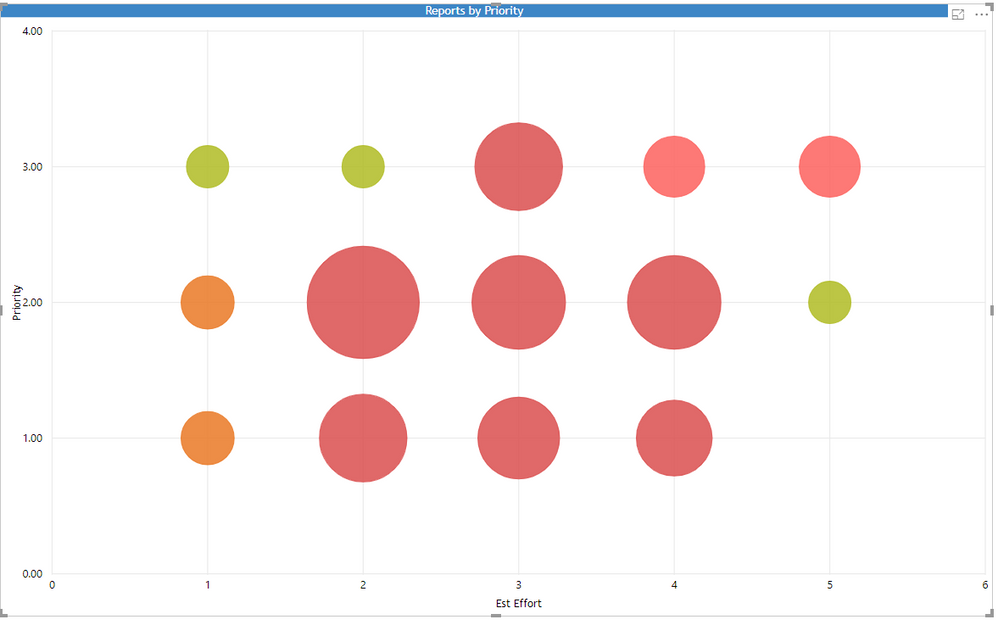
How do I change the colour depending on the location on the graph,


Values that add up to 1-3 red, 4- 5 orange and 6-8 green 


Priority.PNG


I have created a calculated column summing the numerical value of Priority and Effort.


These values are between 1 and 8 but I am unsure where to go from here. 


Thanks in advance

1 ACCEPTED SOLUTION
v-danhe-msft
Microsoft Employee
Microsoft Employee

Hi @Anonymous,

Based on my test, you could refer to below step:

Create measure:

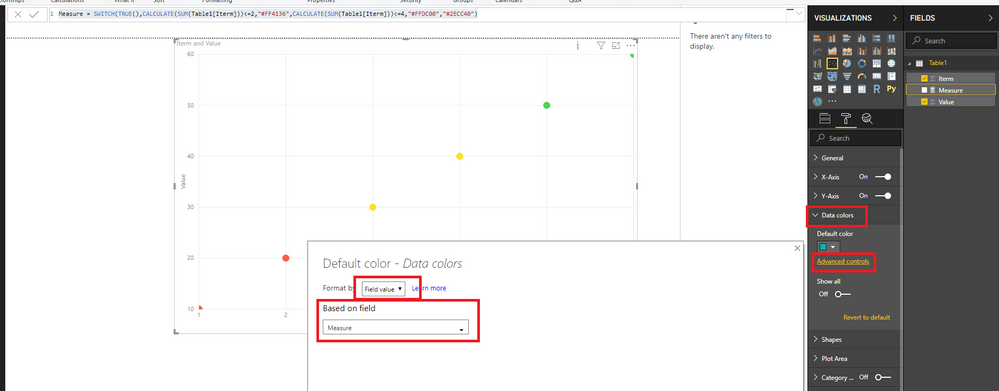
Measure = SWITCH(TRUE(),CALCULATE(SUM(Table1[Iterm]))<=2,"#FF4136",CALCULATE(SUM(Table1[Iterm]))<=4,"#FFDC00","#2ECC40")
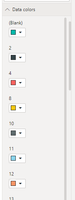
And open the Advanced controls in data color to modify your color:
1.PNG
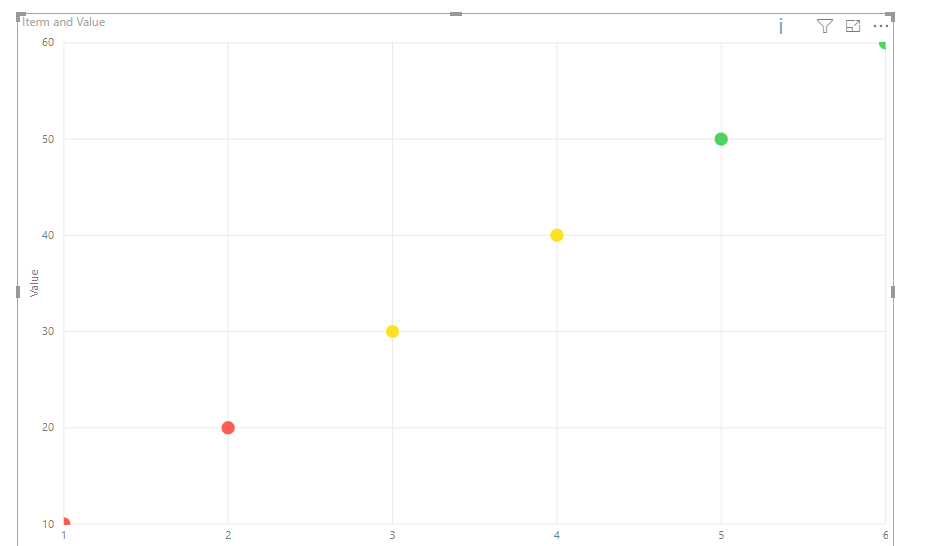
Result:
1.PNG
You could also refer to below blog:
 
Regards,
Daniel He
Community Support Team _ Daniel He
If this post helps, then please consider Accept it as the solution to help the other members find it more quickly.

View solution in original post

5 REPLIES 5
marijkedegreef
New Member

Hi,

I also want to use conditional formatting for a scatter chart. My current chart shows volume on the X-as and unit margin on the Y-as per customer. The customer name is shown per dot.


Additional I want to use conditional colouring on the dots for example:

Blue dots - customers from the US

Green dots- customers from Europe

Purple dots - customers from Asia


Can someone help me? Thanks

v-danhe-msft
Microsoft Employee
Microsoft Employee

Hi @Anonymous,

Based on my test, you could refer to below step:

Create measure:

Measure = SWITCH(TRUE(),CALCULATE(SUM(Table1[Iterm]))<=2,"#FF4136",CALCULATE(SUM(Table1[Iterm]))<=4,"#FFDC00","#2ECC40")
And open the Advanced controls in data color to modify your color:
1.PNG
Result:
1.PNG
You could also refer to below blog:
 
Regards,
Daniel He
Community Support Team _ Daniel He
If this post helps, then please consider Accept it as the solution to help the other members find it more quickly.
Anonymous
Not applicable

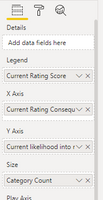
1.PNG2.PNG3.PNG


Hi @v-danhe-msft, I'm using Aug 19 desktop and don't have the advanced colour option for conditional formatting (see above). Any thoughts upon why this could be please?


Yes, as @Anonymous notes, the "Advanced controls" has disappeared! Even now on May 2020 release!


Badly need transparency - please vote here, and Conditional Formatting would be great too. Bring it back urgently!

Anonymous
Not applicable

Hi @v-danhe-msft,


This worked perfectly.


Thank you 

Helpful resources

Announcements
FabCon and SQLCon Barcelona 2026

FabCon & SQLCon – Barcelona 2026

Join us in Barcelona for FabCon and SQLCon, the Fabric, Power BI, SQL, and AI community event. Save €200 with code FABCMTY200.

60 days of Data Days Carousel

Data Days 2026

Join Data Days 2026: 60 days of free live/on-demand sessions, challenges, study groups, and certification opportunities.

Power BI DataViz World Championships carousel

Power BI DataViz World Championships - June 2026

A new Power BI DataViz World Championship is coming this June! Don't miss out on submitting your entry.

Top Solution Authors
Top Kudoed Authors