Get certified for free when you join Fabric Data Days 2026 and dive into Fabric, Power BI, SQL, AI, and other essential data skills.
Join nowJuly 7 - July 17 | Round 2 of the Power BI Dataviz World Championships. Don't miss your chance! Learn more
Hi,
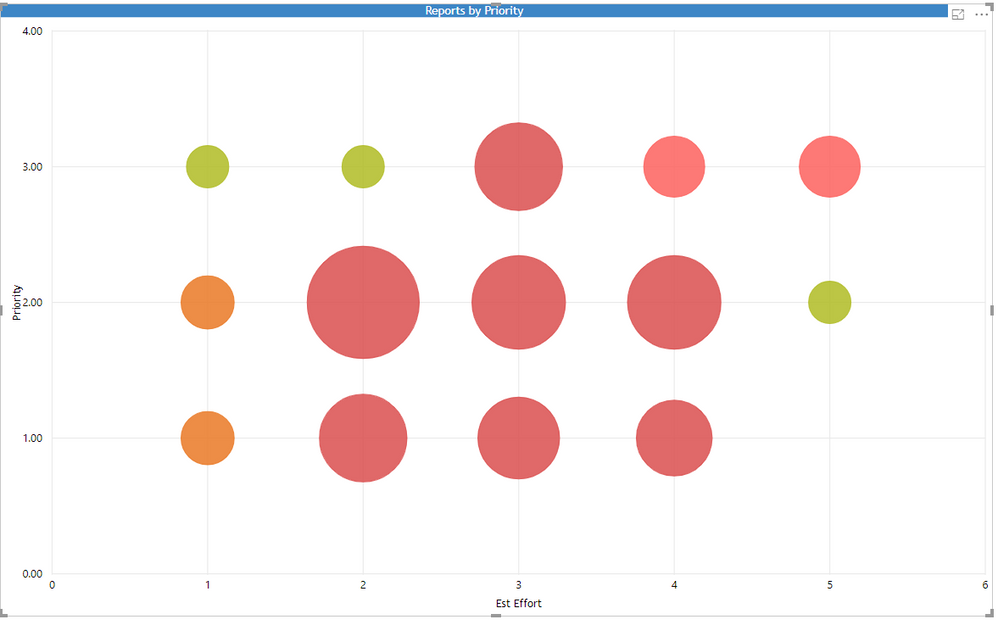
How do I change the colour depending on the location on the graph,
Values that add up to 1-3 red, 4- 5 orange and 6-8 green
I have created a calculated column summing the numerical value of Priority and Effort.
These values are between 1 and 8 but I am unsure where to go from here.
Thanks in advance
Solved! Go to Solution.
Hi @Anonymous,
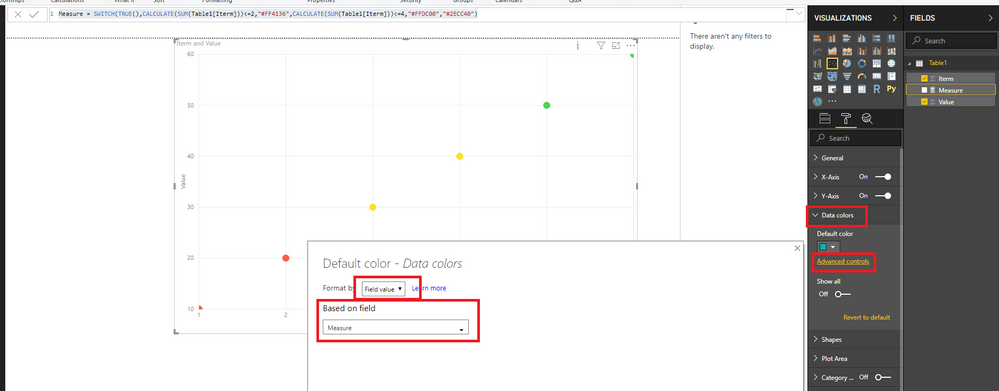
Based on my test, you could refer to below step:
Create measure:
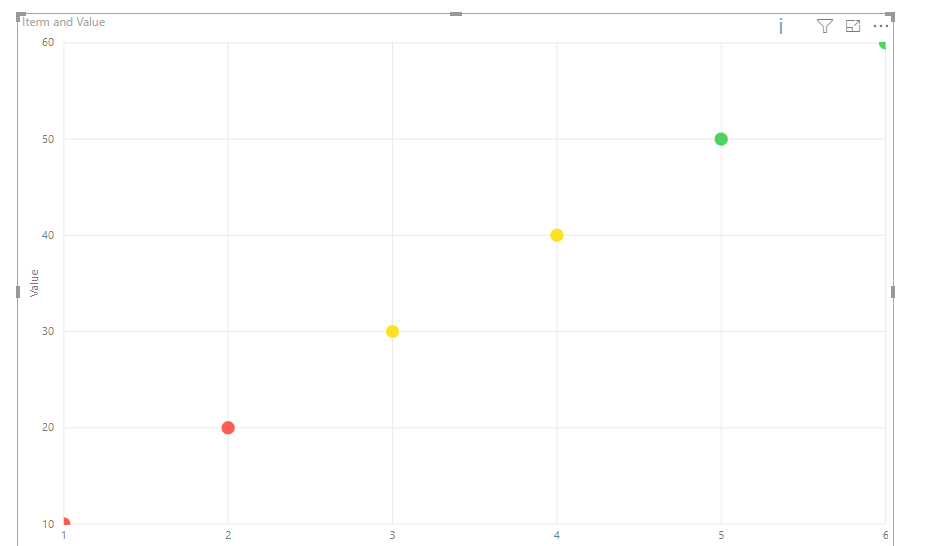
Measure = SWITCH(TRUE(),CALCULATE(SUM(Table1[Iterm]))<=2,"#FF4136",CALCULATE(SUM(Table1[Iterm]))<=4,"#FFDC00","#2ECC40")And open the Advanced controls in data color to modify your color:
Hi,
I also want to use conditional formatting for a scatter chart. My current chart shows volume on the X-as and unit margin on the Y-as per customer. The customer name is shown per dot.
Additional I want to use conditional colouring on the dots for example:
Blue dots - customers from the US
Green dots- customers from Europe
Purple dots - customers from Asia
Can someone help me? Thanks
Hi @Anonymous,
Based on my test, you could refer to below step:
Create measure:
Measure = SWITCH(TRUE(),CALCULATE(SUM(Table1[Iterm]))<=2,"#FF4136",CALCULATE(SUM(Table1[Iterm]))<=4,"#FFDC00","#2ECC40")And open the Advanced controls in data color to modify your color:
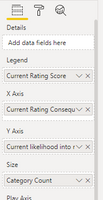
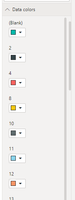
Hi @v-danhe-msft, I'm using Aug 19 desktop and don't have the advanced colour option for conditional formatting (see above). Any thoughts upon why this could be please?
Yes, as @Anonymous notes, the "Advanced controls" has disappeared! Even now on May 2020 release!
Badly need transparency - please vote here, and Conditional Formatting would be great too. Bring it back urgently!
Join us in Barcelona for FabCon and SQLCon, the Fabric, Power BI, SQL, and AI community event. Save €200 with code FABCMTY200.
Join Data Days 2026: 60 days of free live/on-demand sessions, challenges, study groups, and certification opportunities.
| User | Count |
|---|---|
| 27 | |
| 24 | |
| 18 | |
| 15 | |
| 15 |
| User | Count |
|---|---|
| 63 | |
| 42 | |
| 41 | |
| 38 | |
| 37 |