Get certified for free when you join Fabric Data Days 2026 and dive into Fabric, Power BI, SQL, AI, and other essential data skills.
Join nowJuly 28 - August 9 | Final Round of the Power BI Dataviz World Championships. This is your chance. Learn more
Hello,
I have a column called Variance. I need a color formatting for this column based on below
-5 to +5 as Green Color
-10 to +10 as Blue Color
-20 to +20 as Red Color.
I only see three options in conditional formatting Min,Max and Diverging.
Any help is appreciated.
Hi @pxg08680,
There are superpositions in your intervals. How to define the color of 0?
Such formatting isn't supported by now. Please vote or create a new idea here: conditional-formatting-intervals. Maybe there is a workaround.
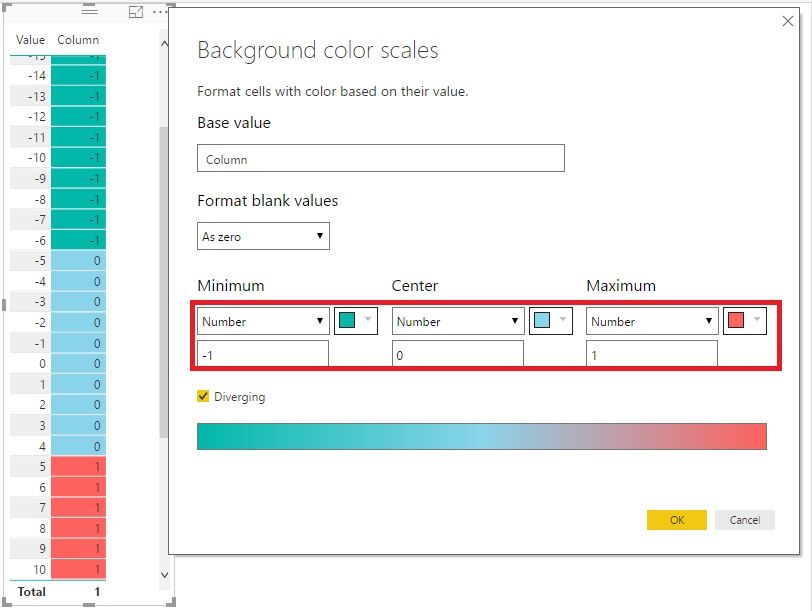
1. Add a new Calculated Column like this:
Column = IF ( [Value] < -5, -1, IF ( [Value] < 5, 0, 1 ) )
2. Format it like this:
Best Regards!
Dale
If you love stickers, then you will definitely want to check out our community sticker challenge, Barcelona edition!
Check out the July 2026 Power BI update to learn about new features.
| User | Count |
|---|---|
| 28 | |
| 28 | |
| 19 | |
| 19 | |
| 19 |
| User | Count |
|---|---|
| 35 | |
| 26 | |
| 18 | |
| 18 | |
| 17 |