This is best Fabric, Power BI, SQL and AI community event. How do we know? The last event sold out! Save €200 with code FABCMTY200.
Register nowThe Fabric community is now in read-only for platform upgrade. Learn more
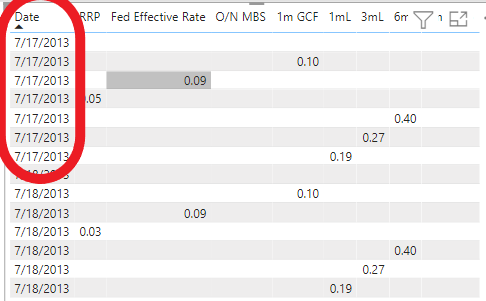
I have different fields all associated with the same date but for some reason I'm getting multiple lines instead of just showing it under one single day. How can I fix this?
Solved! Go to Solution.
Hi @hspenik3
Use Matrix and put the dates in the Column
Regards
Amine Jerbi
If I answered your question, please mark this thread as accepted
and you can follow me on
My Website, LinkedIn and Facebook
HI @hspenik3,
Can please share some dummy data with a similar data structure and expected results? It should help us clarify your scenario and test to coding formula.
How to Get Your Question Answered Quickly
Regards,
Xiaoxin Sheng
@hspenik3 , I think your date has a time stamp, and you are not able to see it because of the format.
Change the data type to date/time and choose a format that can show you time
and get a date column like
new Date = [Date].date
or
new Date = date(year([Date]),month([Date]),day([Date]))
Hi @hspenik3
Use Matrix and put the dates in the Column
Regards
Amine Jerbi
If I answered your question, please mark this thread as accepted
and you can follow me on
My Website, LinkedIn and Facebook
Join us in Barcelona for FabCon and SQLCon, the Fabric, Power BI, SQL, and AI community event. Save €200 with code FABCMTY200.
| User | Count |
|---|---|
| 20 | |
| 18 | |
| 14 | |
| 13 | |
| 13 |
| User | Count |
|---|---|
| 48 | |
| 35 | |
| 24 | |
| 20 | |
| 19 |