Get certified for free when you join Fabric Data Days 2026 and dive into Fabric, Power BI, SQL, AI, and other essential data skills.
Join nowJuly 28 - August 9 | Final Round of the Power BI Dataviz World Championships. This is your chance. Learn more
Hi,
I'm trying to group visuals, as explained in this link. Grouping visuals
However, I simply don't have any option at right-click to gropu visuals. I've just downloaded the most recent PowerBi, which was suggested in this question.
Any advice please?
Kind regards,
Malan
Solved! Go to Solution.
Hi @Anonymous ,
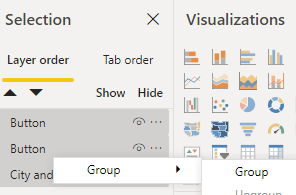
You need to use Ctrl+Left Click to select these layer in the selection pane. Then Right Click it and group menu will appear.
Hi @v-eachen-msft , The selection pane was open when I tried that. Still no option on right-click for grouping visuals. (I also right-clicked in various places, to make sure it's not about clicking in a data area or so).
Hi @Anonymous ,
You need to use Ctrl+Left Click to select these layer in the selection pane. Then Right Click it and group menu will appear.
Hi @Anonymous ,
You need to active selection pane firstly.
Then follow the document you mentioned.
If you love stickers, then you will definitely want to check out our community sticker challenge, Barcelona edition!
Check out the July 2026 Power BI update to learn about new features.
| User | Count |
|---|---|
| 30 | |
| 28 | |
| 23 | |
| 21 | |
| 19 |
| User | Count |
|---|---|
| 39 | |
| 31 | |
| 18 | |
| 17 | |
| 15 |