Get certified for free when you join Fabric Data Days 2026 and dive into Fabric, Power BI, SQL, AI, and other essential data skills.
Join nowJuly 28 - August 9 | Final Round of the Power BI Dataviz World Championships. This is your chance. Learn more
Hi,
In the attached simplified example below, I'd like to create a measure which will always sum the first three row values in the table.
The current measure I've written is a calculate measure but uses the expression as the Company 1 values. This means it's specific to Company 1 so for Company 2 I'd have to duplicate it.
The new measure would ideally not require a specific company to be used in the measure expression to calculate the first three rows.
https://1drv.ms/u/s!Ajcv_9xvRfBd5ztQeRbRnFa5h1Am?e=mO0Ncf
Hope that makes sense.
Thanks for reading.
Solved! Go to Solution.
Hi, @smitpau
Based on your description, you may create a measure as below. The pbix file is attached in the end.
Sum First 3 =
SUMX(
SUMMARIZE(
'Table',
'Table'[Company],
"Result",
SWITCH(
[Company],
"Company1",
CALCULATE(
SUM('Company 1'[Value]),
FILTER(
ALL('Company 1'),
VALUE([SI])<4
)
),
"Company2",
CALCULATE(
SUM('Company 2'[Value]),
FILTER(
ALL('Company 2'),
VALUE([SI])<4
)
)
)
),
[Result]
)
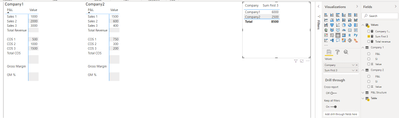
Result:
Best Regards
Allan
If this post helps, then please consider Accept it as the solution to help the other members find it more quickly.
Hi, @smitpau
Based on your description, you may create a measure as below. The pbix file is attached in the end.
Sum First 3 =
SUMX(
SUMMARIZE(
'Table',
'Table'[Company],
"Result",
SWITCH(
[Company],
"Company1",
CALCULATE(
SUM('Company 1'[Value]),
FILTER(
ALL('Company 1'),
VALUE([SI])<4
)
),
"Company2",
CALCULATE(
SUM('Company 2'[Value]),
FILTER(
ALL('Company 2'),
VALUE([SI])<4
)
)
)
),
[Result]
)
Result:
Best Regards
Allan
If this post helps, then please consider Accept it as the solution to help the other members find it more quickly.
For each company sum up the values where [SI] is between 1 and 3.
Why do you have separate tables per company? You shoud combine the tables into one, either via DAX UNION() or better in Power Query.
If you love stickers, then you will definitely want to check out our community sticker challenge, Barcelona edition!
Check out the July 2026 Power BI update to learn about new features.
| User | Count |
|---|---|
| 29 | |
| 28 | |
| 20 | |
| 20 | |
| 19 |
| User | Count |
|---|---|
| 35 | |
| 28 | |
| 21 | |
| 19 | |
| 17 |