Get certified for free when you join Fabric Data Days 2026 and dive into Fabric, Power BI, SQL, AI, and other essential data skills.
Join nowJuly 7 - July 17 | Round 2 of the Power BI Dataviz World Championships. Don't miss your chance! Learn more
Hi there!
I would like to create a visual of the average process time of multiple issues of an organisation. In the screenshot you can see the fields were available.
So, when the Status column show 'Resolved' a new custom column must show the process time of field 'Created' to 'LastModified'. Next i would like a visual (think the Q&A visual) where i can select the 'OwnerCompany' en PowerBI shows me de average process time of all issues of the organisation with the Status 'Resolved'.
Have you ideas?
Solved! Go to Solution.
Ok. I guess I need to see the file to help you better.
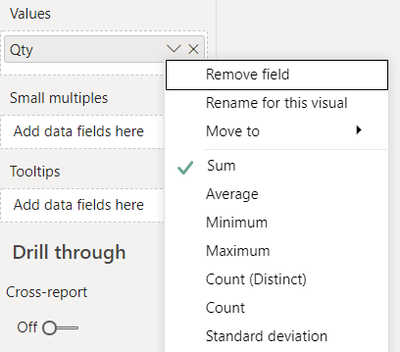
Nonetheless, the custom column that you created earlier, you can still use it and display the Average using a QnA visual or by right clicking on your column name under the Values section of your visual and selecting "Average" from there.
Thanks,
Dheeraj
Hi @mdejong ,
Use two slicers on your report. One for "Status" and another for "OwnerCompany". Next, create a measure as:
Average Process Time = Calculate(sum('TableName'[LastModified]) - sum('TableName'[Created]))
You can add a custome column the same way as of measure.
Thanks,
Dheeraj
If this post helps, then please consider Accept it as the solution and give thumbs up to help the other members find it more quickly.
Thank you @dkaushik! What do you mean with 'TableName' in the calculate rule?
Currently i use a custom column 'diff = 1.0 * ([LastModified] - [Created])', then the Q&A visual with 'average diff'. When clicking on the slicer the results are visualized.
Ahh. The actual name of your table which contains the said fields.
Allright @dkaushik, my TableName = 'Issues (19-00795 - Nb 46 appartementen De Horn Fase 3)'. So i used:
Ok. I guess I need to see the file to help you better.
Nonetheless, the custom column that you created earlier, you can still use it and display the Average using a QnA visual or by right clicking on your column name under the Values section of your visual and selecting "Average" from there.
Thanks,
Dheeraj
Join us in Barcelona for FabCon and SQLCon, the Fabric, Power BI, SQL, and AI community event. Save €200 with code FABCMTY200.
Join Fabric Data Days 2026: 60 days of free live/on-demand sessions, challenges, study groups, and certification opportunities.
| User | Count |
|---|---|
| 22 | |
| 20 | |
| 14 | |
| 13 | |
| 13 |
| User | Count |
|---|---|
| 62 | |
| 40 | |
| 38 | |
| 38 | |
| 38 |