Join the #PBI10 DataViz contest
Power BI is turning 10, and we’re marking the occasion with a special community challenge. Use your creativity to tell a story, uncover trends, or highlight something unexpected.
Get started- Power BI forums
- Get Help with Power BI
- Desktop
- Service
- Report Server
- Power Query
- Mobile Apps
- Developer
- DAX Commands and Tips
- Custom Visuals Development Discussion
- Health and Life Sciences
- Power BI Spanish forums
- Translated Spanish Desktop
- Training and Consulting
- Instructor Led Training
- Dashboard in a Day for Women, by Women
- Galleries
- Webinars and Video Gallery
- Data Stories Gallery
- Themes Gallery
- Contests Gallery
- Quick Measures Gallery
- Notebook Gallery
- Translytical Task Flow Gallery
- R Script Showcase
- Ideas
- Custom Visuals Ideas (read-only)
- Issues
- Issues
- Events
- Upcoming Events
Join us for an expert-led overview of the tools and concepts you'll need to become a Certified Power BI Data Analyst and pass exam PL-300. Register now.
- Power BI forums
- Forums
- Get Help with Power BI
- Service
- Re: What is the Interactive "AI Function Evaluatio...
- Subscribe to RSS Feed
- Mark Topic as New
- Mark Topic as Read
- Float this Topic for Current User
- Bookmark
- Subscribe
- Printer Friendly Page
- Mark as New
- Bookmark
- Subscribe
- Mute
- Subscribe to RSS Feed
- Permalink
- Report Inappropriate Content
What is the Interactive "AI Function Evaluation" operation?
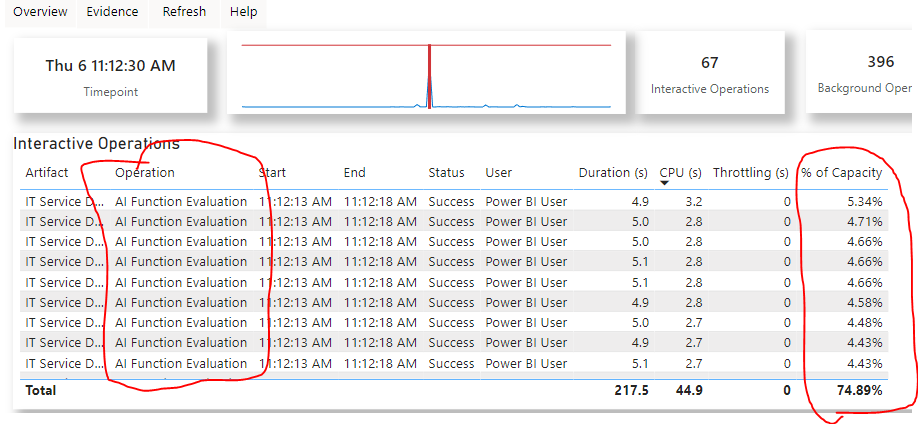
My gen2 capacity has alerted me to a spike in usage. When reviewing the gen2 capacity usage report, I see the below image.
At a very specific time, multiple occurences of "AI function evaluation" occurred at the exact same time to the second, under "Interactive Operations".
The dataset was not refreshed, so I'm assuming someone is doing something in the report causing this action?
The report itself is very basic. It shows fields in a matrix, but does allow the users to personalize their views.
How do I tell what caused this spike leading to over 75% usage of my capacity?
- Mark as New
- Bookmark
- Subscribe
- Mute
- Subscribe to RSS Feed
- Permalink
- Report Inappropriate Content
According to the microsoft documentation it says that the AI Function Evaluation is caused by copilot activities. I recently investigated this and found that copilot activities are listed as "Copilot in Fabric" when used in both desktop and service. As for the AI Function Evaluation I tested this with a few reports on our one of our capacities and found that if the developers add Q&A or narrative chart in any of the report pages as the users interact with the visuals the narrative updates the insights based on these interactions and the consumption units for the insights generated are listed as the AI Function Evaluation.
You can add these visuals in any of your reports and test
- Mark as New
- Bookmark
- Subscribe
- Mute
- Subscribe to RSS Feed
- Permalink
- Report Inappropriate Content
- Report Settings – You can disable insights directly in the report settings.
- Admin Portal (Tenant Settings) – Search for “insights” in Tenant Settings; there should be two relevant settings.
I've attached both settings below for reference.
Details of the Two Settings:
- Receive notifications for top insights (Preview)
Users in the organization can enable notifications for top insights in report settings.
Learn more about insights here.
- Show entry points for insights (Preview)
Users in the organization can use entry points for requesting insights inside reports.
Learn more about insights here.
Note: only report creator or tenant admin can view/edit the settings
- Mark as New
- Bookmark
- Subscribe
- Mute
- Subscribe to RSS Feed
- Permalink
- Report Inappropriate Content
Hi @sxz ,
If your tenant admin enabled copilot even the operation can be triggered from copilot.
When Copilot operates within Microsoft Fabric, it utilizes resources from the premium capacity, including CPU and other computational resources. The usage of these resources is tracked and reported as part of the Al function evaluation metrics.
I hope it will be helpful.
Thanks,
Sai Teja
- Mark as New
- Bookmark
- Subscribe
- Mute
- Subscribe to RSS Feed
- Permalink
- Report Inappropriate Content
Are you aware of why this only happens during scheduled refreshes?
Also, I found that disabling the 'Share Q&A synonyms with your organizations' option resolved this. No more AI Function spikes.
Does that resonate with you? Thank you.
- Mark as New
- Bookmark
- Subscribe
- Mute
- Subscribe to RSS Feed
- Permalink
- Report Inappropriate Content
I'm having the same issue. However this (AI Function spikes) happens only during scheduled refreshes, which is weird b/c refreshes technically should take background resources other than interactive resources. Very frustrating.
- Mark as New
- Bookmark
- Subscribe
- Mute
- Subscribe to RSS Feed
- Permalink
- Report Inappropriate Content
Hello All,
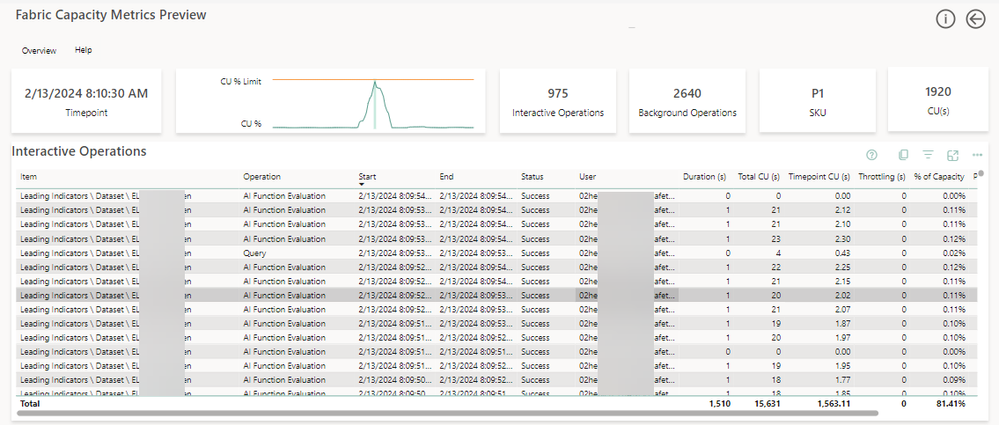
I realize this conversation string is a bit old, but I'd like to resurrect if possible. I feel like I presently have the same question as the original poster. Today our Gateway crashed and we restarted, but during review of the capacity metrics report (yes I upgraded it), I see 81.41% of the CUs at 8:10am and many of these operations are showing AI Function Evaluation and attributed to an end user. This account is a Business user, not a report publisher, which makes it extra curious that it's a background operation and interactive operation. I really feel that there needs to be a better definition of the "AI Function Evaluation" operation, especially if we are supposed to use this report to make sense of our tenant activity.
Thanks for the attention in advance.
Jessie.
- Mark as New
- Bookmark
- Subscribe
- Mute
- Subscribe to RSS Feed
- Permalink
- Report Inappropriate Content
Hi, @Anonymous
I have searched a lot of information and AI Function Evaluation is probably the general name about AI Function Execution.
AI Function Execution Reliability (%): Number of successful executions divided by the total number of executions in the past seven days.
CPU Max (%): Max CPU consumption by the AI workload in the past seven days.
Memory Max (GB): Max memory consumption by the AI workload in the past seven days.
AI Function Execution Max Wait Time (MS): Maximum amount of time before starting execution.
AI Function Execution Average Wait Time (MS): Average amount of time before starting execution.
AI Function Execution Max Duration (MS): Maximum amount of time to complete execution.
AI Function Execution Average Duration (MS): Average amount of time to complete execution.
Best Regards,
Community Support Team _Charlotte
If this post helps, then please consider Accept it as the solution to help the other members find it more quickly.
- Mark as New
- Bookmark
- Subscribe
- Mute
- Subscribe to RSS Feed
- Permalink
- Report Inappropriate Content
I understand what the metrics mean. However, I'm still unclear on what "AI Functions" are.
As it is the operation taking up 75% utilization of my capacity on 1 report for 5 seconds, that is the part I'm looking for.
There is no explicit AI happening within this report. It has 1 table, and 5 slicers. 2 dax measures doing an average count.
- Mark as New
- Bookmark
- Subscribe
- Mute
- Subscribe to RSS Feed
- Permalink
- Report Inappropriate Content
Interesting question...
This documentation seems to suggest that AI workloads are not interactive operations:
https://docs.microsoft.com/en-us/power-bi/admin/service-premium-gen2-faq
The following events are interactive operations:
- Datasets workload - Report View, Query, XMLA read
- Dataflows workloads
- Paginated Report workload - paginated report render
The following are background operations:
- Datasets workload - scheduled refresh, on-demand refresh, background query (after refresh)
- Dataflows workload - scheduled dataflow refresh
- Paginated reports workload - data driven subscriptions renders
- Export report to file API calls
- AI workloads
- Mark as New
- Bookmark
- Subscribe
- Mute
- Subscribe to RSS Feed
- Permalink
- Report Inappropriate Content
Thank you for that link, that didn't turn up in my searches.
This particular report is refreshed overnight, so based on the times it would be something caused by interaction from a user.
I'm also curious as to what it may be that caused high number of 5% usage actions that all occurred at the exact same second in time.
This report is published in sharepoint, so MOST users would not have access to thinks like insights generation or other visuals that would cause azure AI to be used.
Very few people have a pro license to view this report within the portal to allow them to initiate any AI related visuals.
Helpful resources

Join our Fabric User Panel
This is your chance to engage directly with the engineering team behind Fabric and Power BI. Share your experiences and shape the future.

Power BI Monthly Update - June 2025
Check out the June 2025 Power BI update to learn about new features.

| User | Count |
|---|---|
| 57 | |
| 28 | |
| 25 | |
| 22 | |
| 21 |
| User | Count |
|---|---|
| 58 | |
| 45 | |
| 24 | |
| 24 | |
| 18 |


