This is best Fabric, Power BI, SQL and AI community event. How do we know? The last event sold out! Save €200 with code FABCMTY200.
Register nowThe Fabric community is upgrading! Read all of the details including the timeline and what you can expect. Learn more
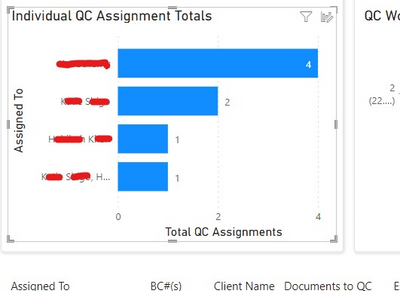
I used the Integrate feature to create a Power BI visual using data from a SharePoint List. One column in the list is multiple selection people profiles. When this column is shown in Power BI, it combines the two people in the assigned column, but I'd like to keep them separate. Kind of hard to explain so I am attaching screenshots.
This is the List. It shows that K.S. is assigned to two projects solo, and one project with H.K. (who is also assigned one solo project). I would like it to show up in Power BI as K.S. is assigned to 3 projects and H.K. is assigned to 2 projects. Instead, it combines them in the report:
Is it possible to separate them out?
Honestly I prefer connecting directly to the SP list vs using the "integrate" feature - you get more control of the data. If you use the SP Online List connector, it will let you expand the "people" data fields to new rows, get their name, department, job title, etc - it's much better to work with.
I did a video here on how to connect to SP lists that includes how to get people data into a dimension table so that you can interact with it in the way you're asking: https://youtu.be/LYu3wqb2Nx4?si=xxo34YYWcZ57htVM
Yeah, unless you have thousands of users in your User Information List. Expanding columns is an expensive action.
Yeah, the new flat architecture seems to help with this some - not having to support a massive number of subsites does wonders for keeping things to a reasonable size.
You would use Power query action to separate the list entries of the users (split column...into rows).
Join us in Barcelona for FabCon and SQLCon, the Fabric, Power BI, SQL, and AI community event. Save €200 with code FABCMTY200.
| User | Count |
|---|---|
| 14 | |
| 11 | |
| 9 | |
| 7 | |
| 5 |