
Get certified for free when you join Fabric Data Days 2026 and dive into Fabric, Power BI, SQL, AI, and other essential data skills.
Join nowJuly 7 - July 17 | Round 2 of the Power BI Dataviz World Championships. Don't miss your chance! Learn more
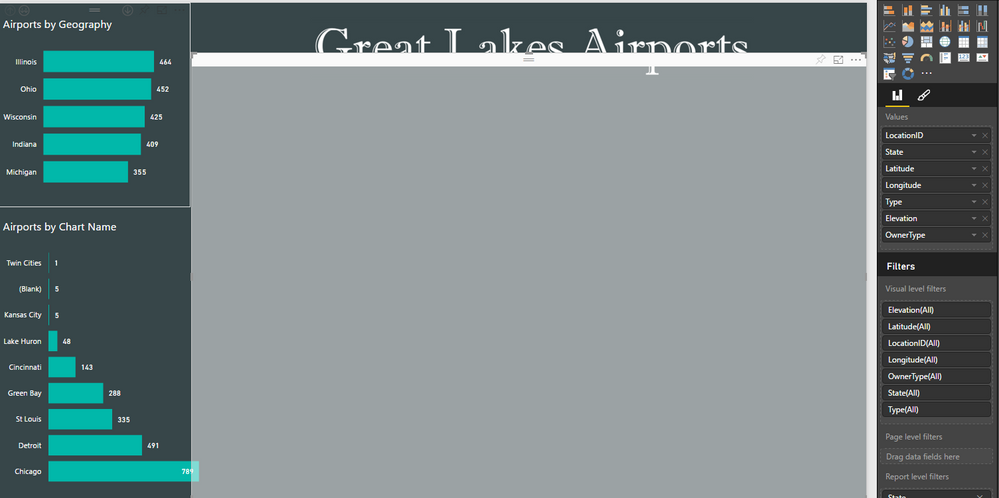
This afternoon, I started receiving an "Enable script visuals" button on the notification bar with reports that were published to Service with R visuals included. The R visuals are blank, however. Does anyone else see this behavior, or do the visuals appear correctly?
I experience the same problem - when a PBI with R visuals is published to the service, there is a warning about the script and the R visuals are not displayed - the error reported for each visual is "Couldn't retrieve the data for this visual. Please try again later."
Was on a web-ex with MS yesterday and they said R Visuals were currently only available in desktop, not service. Support for R Visuals in PBI Service was being worked on, but they couldn't say when it would be available.
It was available on Friday, April 15. Today is Monday, R visuals don't work in PBI Service.
Thank you so much for sharing this.
@deldersveld I can't see R visuals in PBI service either. I remember sometime ago it used to get displayed but not fileterd. So if you have filters applied to your R visuals in PBI desktop it will work there but not in PBI service. I deleted and re-published my report but can't see visual.
Join us in Barcelona for FabCon and SQLCon, the Fabric, Power BI, SQL, and AI community event. Save €200 with code FABCMTY200.
Join Data Days 2026: 60 days of free live/on-demand sessions, challenges, study groups, and certification opportunities.
| User | Count |
|---|---|
| 22 | |
| 12 | |
| 10 | |
| 10 | |
| 4 |
| User | Count |
|---|---|
| 32 | |
| 28 | |
| 27 | |
| 27 | |
| 21 |