cancel
Showing results for 
Search instead for 
Did you mean: 

July 7 - July 17 | Round 2 of the Power BI Dataviz World Championships. Don't miss your chance! Learn more

Reply
Anonymous
Not applicable

Multiply a table column with two different numbers or variable

I'm still a newby..I'm working on a project and there's something I need your help with. I need to multiply the sum total of city with 4.11 and also with 5.0. ..How do I achieve this??

I want these values to display bar charts side by side correctly in this same bar chart. Maybe only want it done with one measure . What expression or query can do this??..Also Can it be done with column as I have not used column before.

See attached 

1 ACCEPTED SOLUTION
Anonymous
Not applicable

Hi  ,

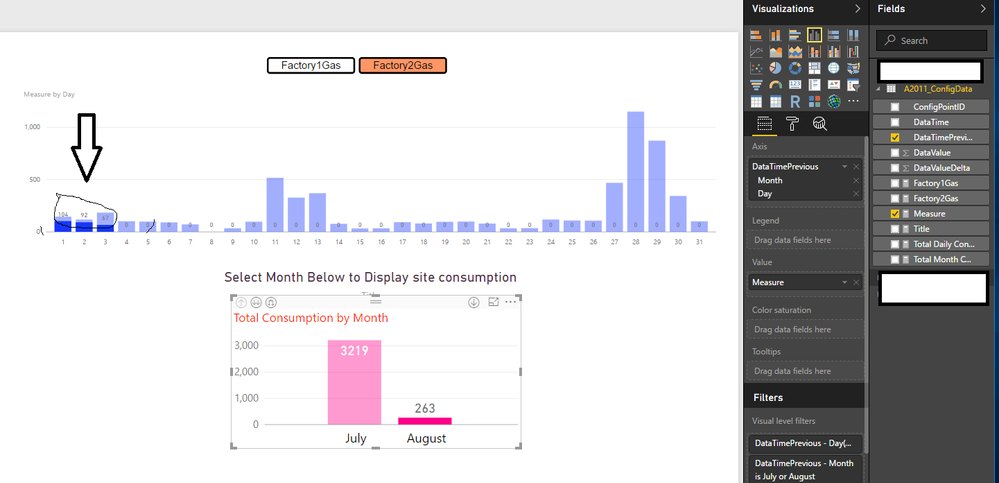
Great Thanks for helping me..The 'Measure' you created for my slicer works perfectly. . ..  but I want to display this 'Measure' for specific month of the year. ie If I click on the 'Factory2Gas' and the Month of 'August', in the bar chart below,  I want only data for 'August' to show in the above bar chart without the chart showing the blurred part(see arrow below).  This happens when i click on specific month for either Factory1Gas or Factory2Gas.. Please Is there an edit to the Measure  or anything I can do to display this accurately..

Problem2: Also the enitre graph  disappear (show nothing)  if I use CTRl to click both Factory1Gas and Factory2Gas together.. Consumption.png


View solution in original post

4 REPLIES 4
v-ljerr-msft
Microsoft Employee
Microsoft Employee

Hi @Anonymous,


I need to multiply the sum total of DataValueDelta with 4.11 and also with 5.0. ..How do I achieve this?? I want these values to display bar charts side by side correctly in this same bar chart. 

You should be able to simply create two measures, then show both the measures as Values on the same bar chart in your scenario. The formulas below to create the measures are for your reference. Smiley Happy

measure1 = SUM ( 'A2011_ConfigData'[DataValueDelta ] ) * 4.11
measure2 = SUM ( 'A2011_ConfigData'[DataValueDelta ] ) * 5


Regards

Anonymous
Not applicable


nn.PNG


Hi @Anonymous,


If I understand you correctly, you should be able to use the formula below to create a new measure, and show this new created measure as Value on the chart. Then the measure will show value for either 'Factory1Gas' or 'Factory2Gas' according your selection on the Slicer. Smiley Happy

measure =
IF (
    HASONEVALUE ( 'A2011_Device'[EUA_Legend] ),
    IF (
        VALUES ( 'A2011_Device'[EUA_Legend] ) = "Factory1Gas",
        [Factory1Gas],
        [Factory2Gas]
    )
)


Regards

Anonymous
Not applicable

Hi  ,

Great Thanks for helping me..The 'Measure' you created for my slicer works perfectly. . ..  but I want to display this 'Measure' for specific month of the year. ie If I click on the 'Factory2Gas' and the Month of 'August', in the bar chart below,  I want only data for 'August' to show in the above bar chart without the chart showing the blurred part(see arrow below).  This happens when i click on specific month for either Factory1Gas or Factory2Gas.. Please Is there an edit to the Measure  or anything I can do to display this accurately..

Problem2: Also the enitre graph  disappear (show nothing)  if I use CTRl to click both Factory1Gas and Factory2Gas together.. Consumption.png


Helpful resources

Announcements
FabCon and SQLCon Barcelona 2026

FabCon & SQLCon – Barcelona 2026

Join us in Barcelona for FabCon and SQLCon, the Fabric, Power BI, SQL, and AI community event. Save €200 with code FABCMTY200.

60 days of Data Days Carousel

Data Days 2026

Join Data Days 2026: 60 days of free live/on-demand sessions, challenges, study groups, and certification opportunities.

Power BI DataViz World Championships carousel

Power BI DataViz World Championships - June 2026

A new Power BI DataViz World Championship is coming this June! Don't miss out on submitting your entry.

Top Kudoed Authors