Get Fabric certified for FREE!
Don't miss your chance to take the Fabric Data Engineer (DP-600) exam for FREE! Find out how by attending the DP-600 session on April 23rd (pacific time), live or on-demand.
Learn more- Power BI forums
- Get Help with Power BI
- Desktop
- Service
- Report Server
- Power Query
- Mobile Apps
- Developer
- DAX Commands and Tips
- Custom Visuals Development Discussion
- Health and Life Sciences
- Power BI Spanish forums
- Translated Spanish Desktop
- Training and Consulting
- Instructor Led Training
- Dashboard in a Day for Women, by Women
- Galleries
- Data Stories Gallery
- Themes Gallery
- Contests Gallery
- QuickViz Gallery
- Quick Measures Gallery
- Visual Calculations Gallery
- Notebook Gallery
- Translytical Task Flow Gallery
- TMDL Gallery
- R Script Showcase
- Webinars and Video Gallery
- Ideas
- Custom Visuals Ideas (read-only)
- Issues
- Issues
- Events
- Upcoming Events
Next up in the FabCon + SQLCon recap series: The roadmap for Microsoft SQL and Maximizing Developer experiences in Fabric. All sessions are available on-demand after the live show. Register now
- Power BI forums
- Forums
- Get Help with Power BI
- Service
- Re: Monitor memory during refresh
- Subscribe to RSS Feed
- Mark Topic as New
- Mark Topic as Read
- Float this Topic for Current User
- Bookmark
- Subscribe
- Printer Friendly Page
- Mark as New
- Bookmark
- Subscribe
- Mute
- Subscribe to RSS Feed
- Permalink
- Report Inappropriate Content
Monitor memory during refresh
Hi Community,
I am looking for ways to gain more insights into what is happening on my capacity during refreshes in terms of memory usage. I have several refreshes that fail because of insufficient memory.
I know there are several tools, but I am not sure on how to use them 100%.
1) The Capacity Metrics App gives great insights about the CU at any given point in time. Not my problem here. There's no peak in CU during my failed refresh.
2) The Log Analytics Workspace Report. I can see lots of things here, but anything related to memory consumption to a given point?
3) The Log Analytics Workspace - thanks to a KQL query and Chris Webs blog I believe I found my Memory Peak is 7 GB:
[@"PowerBIDatasetsWorkspace"]
| where OperationName == "CommandEnd" and EventText contains "PeakMemory" and TimeGenerated >= (datetime(2023-10-24 10:51:03)) and TimeGenerated <= (datetime(2023-10-24 10:57:50)) and PowerBIWorkspaceName == "Selfservice Datasets"
4) The Vertipaq Analyzer - shows my model is 70 GB in size
My setting:
* I have a Premium P3 capacity. I understand that each dataset can hold up to 100 GB. That includes compressed data as well as uncompressed data during refresh or data caches for users.
* My refreshes don't refresh the whole model but are more like an incremental refresh for refreshing certain partitions.
The question for me as a dataset owner: Why does my refresh fail? I know, because of insufficient memory, but why do I have insufficient memory? 70 GB of compressed data + 7 GB memoryPeak is 77 GB. That should still give the user cache enough memory to work on.
But are 23 GB for queries too less? What queries are consuming how much memory at a given point in time? In Azure Analytics Service there was an option to see the performance monitor with metrics such as memory usage, memory limit and others.
My question to you guys: Have you had similar issues? What are your tools in the box to navigate through the memory issue? Are there even some custom templates or KQL queries available that scan the logs or use the capacity metrics dataset to create more insights?
Solved! Go to Solution.
- Mark as New
- Bookmark
- Subscribe
- Mute
- Subscribe to RSS Feed
- Permalink
- Report Inappropriate Content
Mashup is responsile for all type of refreshes so yes it applies to legacy data sources as well.
That's wired if the max memory during refresh is only 7 GB then it should not cause issue
I would recommand to raise a support request with Microsoft, they would be able to provide you exact memory consumption during refresh as well as anything else that might be consuming memory
If this post helps, then please consider Accept it as the solution, Appreciate your Kudos!!
Proud to be a Super User!!
- Mark as New
- Bookmark
- Subscribe
- Mute
- Subscribe to RSS Feed
- Permalink
- Report Inappropriate Content
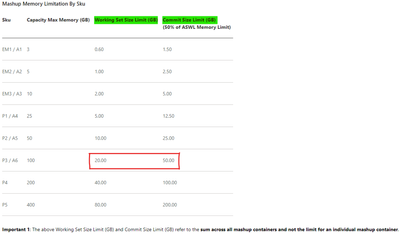
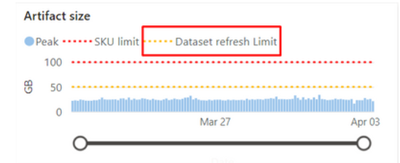
The mashup memory limit is 50% of capacity memory, that will be 50 GB with P3
Same can be found in capacity metrics app
This would be issue for your refreshed getting failed
I would suggest to create smaller partition in your dataste for incremenatal refresh that could help improving the refresh success rate.
If this post helps, then please consider Accept it as the solution, Appreciate your Kudos!!
Proud to be a Super User!!
- Mark as New
- Bookmark
- Subscribe
- Mute
- Subscribe to RSS Feed
- Permalink
- Report Inappropriate Content
Thank you for the insight! From what I know, the mashup memory is dedicated to serve PowerQuery operations. Would you know whether it also applies for legacy data sources?
Besides, incremental refresh is also applied. According to the logs, the memory peak is only 7 GB and thus below the threshold.
- Mark as New
- Bookmark
- Subscribe
- Mute
- Subscribe to RSS Feed
- Permalink
- Report Inappropriate Content
Mashup is responsile for all type of refreshes so yes it applies to legacy data sources as well.
That's wired if the max memory during refresh is only 7 GB then it should not cause issue
I would recommand to raise a support request with Microsoft, they would be able to provide you exact memory consumption during refresh as well as anything else that might be consuming memory
If this post helps, then please consider Accept it as the solution, Appreciate your Kudos!!
Proud to be a Super User!!
- Mark as New
- Bookmark
- Subscribe
- Mute
- Subscribe to RSS Feed
- Permalink
- Report Inappropriate Content
Thank you. I've raised an issue. I'll update this post with whatever will come up, for now, involving support is the solution.
- Mark as New
- Bookmark
- Subscribe
- Mute
- Subscribe to RSS Feed
- Permalink
- Report Inappropriate Content
Yes please do share, it would be learning opportunity for everyone here in community
If this post helps, then please consider Accept it as the solution, Appreciate your Kudos!!
Proud to be a Super User!!
- Mark as New
- Bookmark
- Subscribe
- Mute
- Subscribe to RSS Feed
- Permalink
- Report Inappropriate Content
Hi @GilbertQ
Thank you for your input. The refresh is scheduled every hour and it fails once or twice per day and succeeds all other times. Regarding the memory, what is a capacity memory limit in Gen2? (I just know the 100GB limit per dataset.) There are two other larger datasets present on the capacity but they don't seem to cause the problem.
We have >100 users that query the dataset and quite a lot of them connect via Excel (according to the metrics app). They're my culprit. I believe that they cause some high memory consumption with certain queries during refresh.
Which leads me to a question whether there's a setting that can be enabled to kill the queries in order to give priority to refresh operations?
- Mark as New
- Bookmark
- Subscribe
- Mute
- Subscribe to RSS Feed
- Permalink
- Report Inappropriate Content
The 100GB is for your whole capacity and not just one dataset. All the resources are shared across the capacity. That would also go in line with it hitting the limit sometimes (when people are more active in your tenant maybe?)
The whole P3 capacity has 100GB Ram I think.
I dont know if you can programmatically kill those MDX queries based on consumption. You could turn it off alltogether which is not feasable I guess 😉
Did you think about cutting down the size of this dataset? Maybe not all of the 70GB is actually what people need? Tools like Measure Killer can analyze all connected reports and make sure nothing breaks down - maybe a big chunk of your data model is actually not needed...
Brunner BI focusing on Microsoft Power BI development and consulting
Developers of external tool "Measure Killer"
My blog
- Mark as New
- Bookmark
- Subscribe
- Mute
- Subscribe to RSS Feed
- Permalink
- Report Inappropriate Content
Hi @rks
You ideally do not want to kill sessions, as people are using the dataset.
What I would suggest is to look if you can reduce the dataset size, there are other more advanced settings that you could use such as IsAvailableInMDX which can be set to false if the column is not used in any tables shown or if the column is used in a relationship.
- Mark as New
- Bookmark
- Subscribe
- Mute
- Subscribe to RSS Feed
- Permalink
- Report Inappropriate Content
Hi @rks
It looks to me like even though there is 23GB of free space, as there any other datasets consuming memory on this P3 capacity? As they too would add to the total memory consumed.
If you had to refresh a smaller table does it refresh?
If so then it might be that there is some limit that being hit close to 75% overall memory usage.
Helpful resources

New to Fabric Survey
If you have recently started exploring Fabric, we'd love to hear how it's going. Your feedback can help with product improvements.

Power BI DataViz World Championships - June 2026
A new Power BI DataViz World Championship is coming this June! Don't miss out on submitting your entry.

Join our Fabric User Panel
Share feedback directly with Fabric product managers, participate in targeted research studies and influence the Fabric roadmap.

| User | Count |
|---|---|
| 11 | |
| 11 | |
| 9 | |
| 8 | |
| 8 |


