This is best Fabric, Power BI, SQL and AI community event. How do we know? The last event sold out! Save €200 with code FABCMTY200.
Register nowA new Data Days event is coming soon! This time we’re going bigger than ever. Fabric, Power BI, SQL, AI and more. Don't miss out.
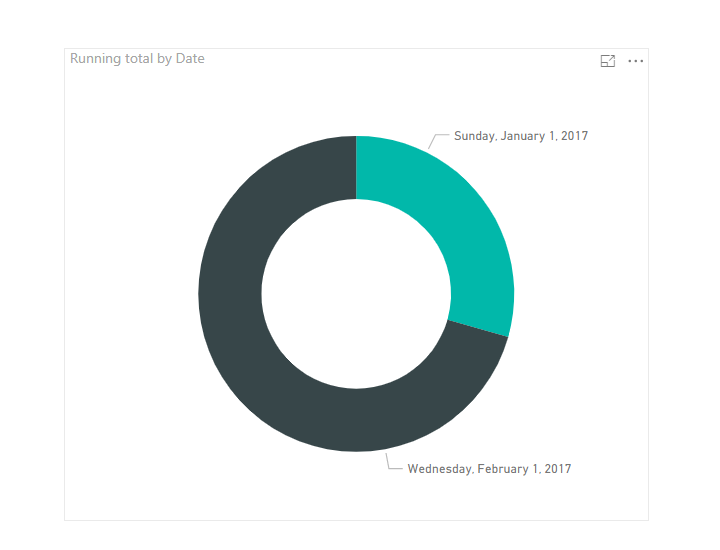
Here is my donut in desktop
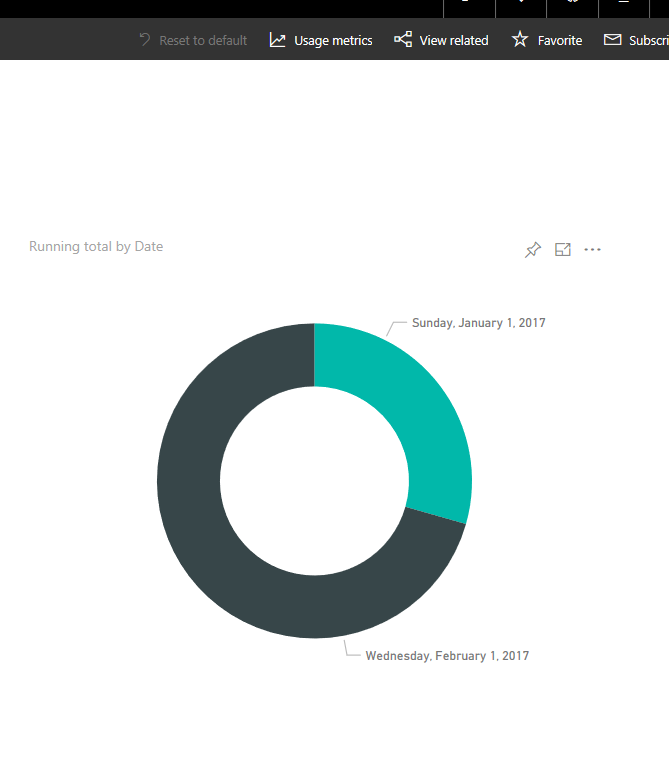
And here is the same donut in Service
The color is totally different and blends in with the other colour set. I cant tell you the color code because you dont get this information in Power BI. Is there an issue with this at the moment?
Hi @DebbieE,
Based on my test, it could work on my side:
Desktop:
Service(I am using the Google Chrome):
Could you have applied any themes in your reports in Desktop? Could you please share your pbix file to have a test?
Regards,
Daniel He
I cant really share my file becuse of the data.
I changed to another colour and that seemed to sort it. Need to watch out for that though. I wish you could see the colour code you were using like you can in Reporting Services. That would make it easier
Hi @DebbieE,
I have checked with my colour code, it is the all the same as #01B8AA and #374649. Could you have tested in other browser? Or you could just create a simple data to share that I could have a test for you.
Regards,
Daniel He
Check out the May 2026 Power BI update to learn about new features.
Sign up to receive a private message when registration opens and key events begin.
If you have recently started exploring Fabric, we'd love to hear how it's going. Your feedback can help with product improvements.
| User | Count |
|---|---|
| 8 | |
| 8 | |
| 7 | |
| 7 | |
| 7 |
| User | Count |
|---|---|
| 21 | |
| 21 | |
| 18 | |
| 16 | |
| 12 |