Get certified for free when you join Fabric Data Days 2026 and dive into Fabric, Power BI, SQL, AI, and other essential data skills.
Join nowJuly 7 - July 17 | Round 2 of the Power BI Dataviz World Championships. Don't miss your chance! Learn more
Hi
I'm creating a Custom visual of network chart. I'm using tooltipServiceWrapper for tooltip functionality but it is not working .
It is showing "cannot read property "tooltipServiceWrapper" undefined".
Please help me.
Thanks In Advance.
Solved! Go to Solution.
Hi @Adithya_L
Kindly refer to this blog whether helps:
http://nightlyclosures.com/2018/02/01/creating-a-custom-visual-in-power-bi/
you could check the Issues forum here:
https://community.powerbi.com/t5/Issues/idb-p/Issues
And if it is not there, then you could post it.
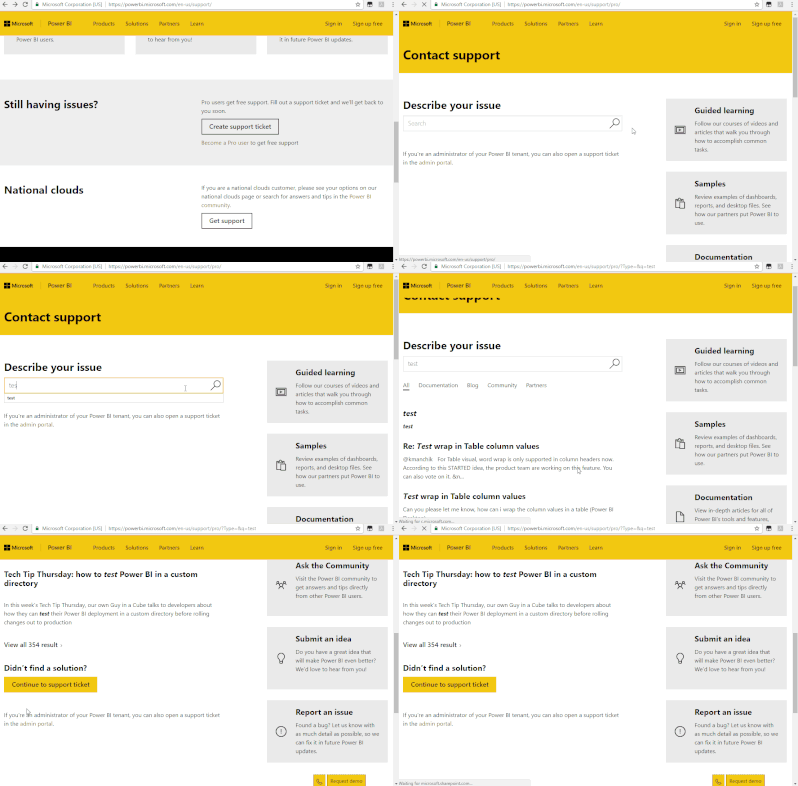
If you have Pro account you could try to open a support ticket. If you have a Pro account it is free. Go to https://support.powerbi.com Scroll down and click "CREATE SUPPORT TICKET".
Hi @Adithya_L
Kindly refer to this blog whether helps:
http://nightlyclosures.com/2018/02/01/creating-a-custom-visual-in-power-bi/
you could check the Issues forum here:
https://community.powerbi.com/t5/Issues/idb-p/Issues
And if it is not there, then you could post it.
If you have Pro account you could try to open a support ticket. If you have a Pro account it is free. Go to https://support.powerbi.com Scroll down and click "CREATE SUPPORT TICKET".
Yeah i tried this too .But the same issue is coming up.
Is the any other solution for this issue.
Join us in Barcelona for FabCon and SQLCon, the Fabric, Power BI, SQL, and AI community event. Save €200 with code FABCMTY200.
Join Fabric Data Days 2026: 60 days of free live/on-demand sessions, challenges, study groups, and certification opportunities.
| User | Count |
|---|---|
| 18 | |
| 12 | |
| 9 | |
| 8 | |
| 5 |
| User | Count |
|---|---|
| 31 | |
| 28 | |
| 27 | |
| 26 | |
| 22 |