Get certified for free when you join Fabric Data Days 2026 and dive into Fabric, Power BI, SQL, AI, and other essential data skills.
Join nowJuly 28 - August 9 | Final Round of the Power BI Dataviz World Championships. This is your chance. Learn more
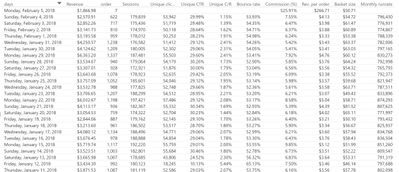
Hi guys, I have the following table displaying some of our key metrics below:
Recently, we had some design changes on our website and want to track how these affect the above metrics. My initial plan was to add a comment to each of the days where we had a design change (similar to Excel where you can right click into a cell and add a comment, so it expands when your cursor reaches that cell), but apart from text boxes in PBI I did not find any sufficient solutions.
Is there an add-in or work around to make this similar to Excel comments where I'd move the cursor to a specific day and I'd expand and then explain the design change which occured?
Thanks a bunch!
Hi OverFlow, did you ever find a solution to this?
joining the req 🙂
Hi @Anonymous,
Except text boxes in PBI, there is no way to add commentary for table, please review the following feature requests and comment on them.
Provide commentary against specific data points/cross sections
I would like to have the possibility to insert comment option for each visual (like the one availabl...
Best Regards,
Angelia
If you love stickers, then you will definitely want to check out our community sticker challenge, Barcelona edition!
Check out the July 2026 Power BI update to learn about new features.
| User | Count |
|---|---|
| 10 | |
| 10 | |
| 9 | |
| 9 | |
| 5 |