Get certified for free when you join Fabric Data Days 2026 and dive into Fabric, Power BI, SQL, AI, and other essential data skills.
Join nowJuly 28 - August 9 | Final Round of the Power BI Dataviz World Championships. This is your chance. Learn more
Hello Everyone,
Recently, i got task from management to create Dashboard which include sales, Non Performing loan (NPL), Total Profit, and etc. For simplicity, assume there's only sales and NPL. Actually, my company had created the Database for Sales and NPL. Of course these data are quite different in nature.
Generally, 'Sales' data consist of the total Amount and Details of each product
While the 'NPL' Data consist of outstanding of Receivables and Aging Type.
When i do these things in excel, i can simply copy the link and put it in the 'summary' sheet. But how can i do these in PowerBI?
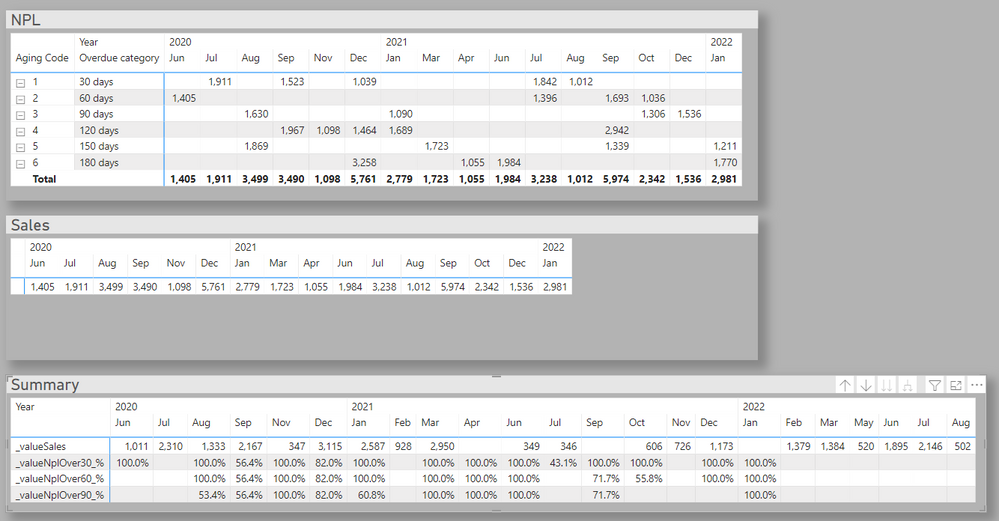
Beside that, i can only think of the solution like this one:
Here is the link to the sample file
Combine data into one Table.xlsx
Best Regards,
Eddy W.
Solved! Go to Solution.
Hi Eddy,
I think this can be achieved by creating a calendar table that aligns the common date dimensions of your two tables.
See attached at the bottom of this post a PBIX that demonstrates how to relate your tables to a common date dimension, and use matrix visuals to combine the different metrics from each table:
Pete
Proud to be a Datanaut!
Hi Eddy,
I think this can be achieved by creating a calendar table that aligns the common date dimensions of your two tables.
See attached at the bottom of this post a PBIX that demonstrates how to relate your tables to a common date dimension, and use matrix visuals to combine the different metrics from each table:
Pete
Proud to be a Datanaut!
If you love stickers, then you will definitely want to check out our community sticker challenge, Barcelona edition!
Check out the July 2026 Power BI update to learn about new features.