Get certified for free when you join Fabric Data Days 2026 and dive into Fabric, Power BI, SQL, AI, and other essential data skills.
Join nowJuly 7 - July 17 | Round 2 of the Power BI Dataviz World Championships. Don't miss your chance! Learn more
Hi,
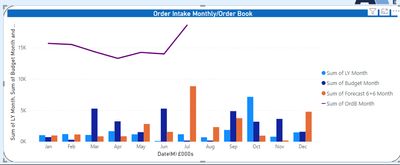
I have some financial data but to show the values in a column chart, I have to make them "Sum of ....", so all my legends have Sum of at the start of them. If i use another measure, it values out at 1 for each month. How can I remove this so it is just LY Month, Budget Month etc..?
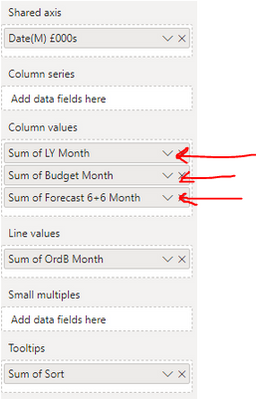
This is my visualisations field (Sum of Sort is my conditional column for ordering the months correctly):
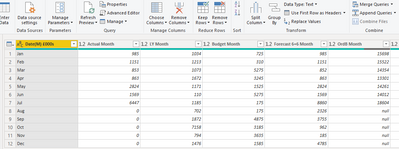
This is my Query Editor (in case it is just a formatting problem) with some of the variables, thanks
Solved! Go to Solution.
Hi @Anonymous ,
In the Column Values section where you've dragged the columns into, just double-click on the column names there and you can overwrite how they are displayed.
FWIW, generally-accepted best practice is that you should always create explicit measures for each of your calculations, even if it's just a basic sum of a column. For example:
LY Month = SUM(yourTable[LY Month])
Pete
Proud to be a Datanaut!
Hi @Anonymous ,
In the Column Values section where you've dragged the columns into, just double-click on the column names there and you can overwrite how they are displayed.
FWIW, generally-accepted best practice is that you should always create explicit measures for each of your calculations, even if it's just a basic sum of a column. For example:
LY Month = SUM(yourTable[LY Month])
Pete
Proud to be a Datanaut!
Ah very simple, great, thanks
Join us in Barcelona for FabCon and SQLCon, the Fabric, Power BI, SQL, and AI community event. Save €200 with code FABCMTY200.
Join Fabric Data Days 2026: 60 days of free live/on-demand sessions, challenges, study groups, and certification opportunities.
| User | Count |
|---|---|
| 8 | |
| 5 | |
| 5 | |
| 4 | |
| 4 |