@Oussov wrote:
Hi,
Suppose I use PowerBI service or embedded and want to send table visual rows to some other web service. How can I do it? I was considering custom R-script or visual, but the network is blocked in the service. With PowerBI embedded, there is no API function for this, I can only get a list of applied filters. And apparently I cannot directly access the report iframe by javascript. Are there any workarounds or is it fundamental limitation?
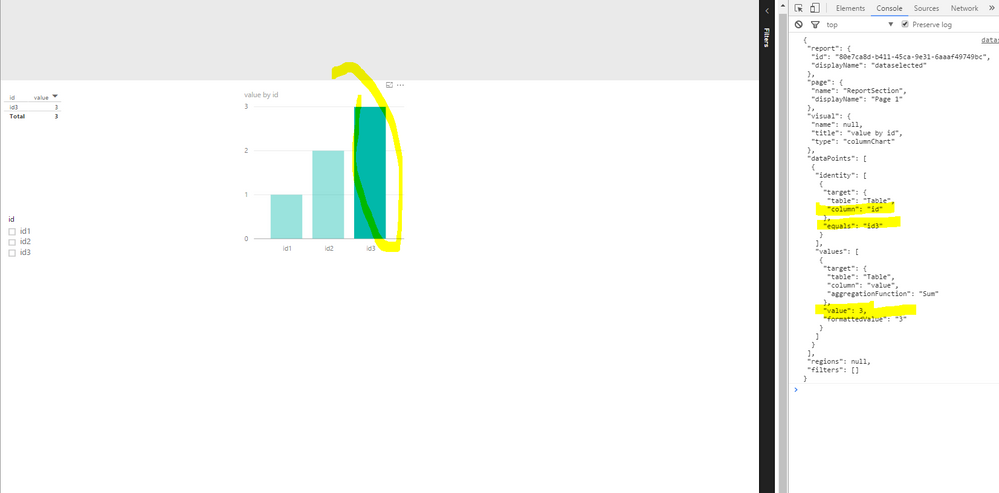
When embedding Power BI reports with PowerBI Javascript API, There's an event called "dataSelected", It can capture the seleced data. eg, when clicking on a histogram, the selected data gets captured.
However, when clicking on a table visual, there no such event triggered. A workaround I can think of is using a column chart that shows the same data in your table visual.
This PowerBI Javascript API can be applied to embed reports from both Power BI Service and Power BI Embedded.
<html>

  <script src="https://microsoft.github.io/PowerBI-JavaScript/demo/node_modules/jquery/dist/jquery.js"></script>

<script src="https://microsoft.github.io/PowerBI-JavaScript/demo/node_modules/powerbi-client/dist/powerbi.js"></script>


<script type="text/javascript">
window.onload = function () {

var embedConfiguration = {
    type: 'report',
    accessToken: 'yourToken',
    id: 'yourReportID',
    embedUrl: 'https://app.powerbi.com/reportEmbed'
};

var $reportContainer = $('#reportContainer');

var report = powerbi.embed($reportContainer.get(0), embedConfiguration);

 var reportPages;


report.on('dataSelected', function(event)
{
var data = event.detail;

         console.log(JSON.stringify(data, null, ' '));

});
 ;


}
</script>

<div  id="reportContainer"></div>
</html>


