Get certified for free when you join Fabric Data Days 2026 and dive into Fabric, Power BI, SQL, AI, and other essential data skills.
Join nowJuly 7 - July 17 | Round 2 of the Power BI Dataviz World Championships. Don't miss your chance! Learn more
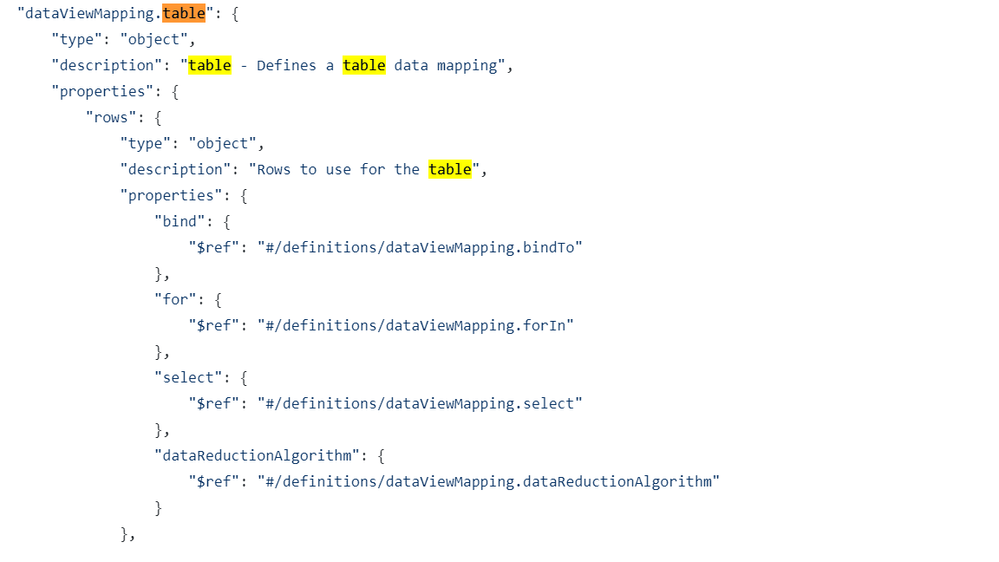
We have multiple columns defined in our data roles definition and need to be able to define them in our corresponding table. All of the examples are showing only 1 column within the table:
"dataViewMappings": [ { "table": { "rows": { "for": { "in": "values" } } } } ]
We've tried to have multiple 'for' objects, multiple 'in' objects but PBI won't compile the definitions. Is there a way we can define multiple columns within this table definition? In v1.9, we got our table for free and now we're attempting to recreate the definition in v2.3 but cannot with our custom visualization.
our data roles:
Hello,
Please try the following example.
"dataRoles": [{
"name": "Fields",
"kind": "Grouping",
"displayName": "Fields"
}, {
"name": "Values",
"kind": "Measure",
"displayName": "Values"
}],
"dataViewMappings": [{
"table": {
"rows": {
"select": [{
"for": {
"in": "Fields"
}
},
{
"for": {
"in": "Values"
}
}
]
}
}
}],
We will add examples with serveral columns to our documentation.
Thanks!
Evgenii Elkin,
Software Engineer
Microsoft Power BI Custom Visuals
[email protected]
Join us in Barcelona for FabCon and SQLCon, the Fabric, Power BI, SQL, and AI community event. Save €200 with code FABCMTY200.
Join Fabric Data Days 2026: 60 days of free live/on-demand sessions, challenges, study groups, and certification opportunities.
| User | Count |
|---|---|
| 2 | |
| 1 | |
| 1 | |
| 1 | |
| 1 |
| User | Count |
|---|---|
| 5 | |
| 3 | |
| 2 | |
| 2 | |
| 2 |