This is best Fabric, Power BI, SQL and AI community event. How do we know? The last event sold out! Save €200 with code FABCMTY200.
Register nowA new Data Days event is coming soon! This time we’re going bigger than ever. Fabric, Power BI, SQL, AI and more. Don't miss out.
Hi,
I'm new to Power BI, but I'm excited about what I see so far. Right now, I'm looking for guidance on how to use some of the custom visuals. Specifically the bullet and guage visuals. Can anyone point me in the right direction?
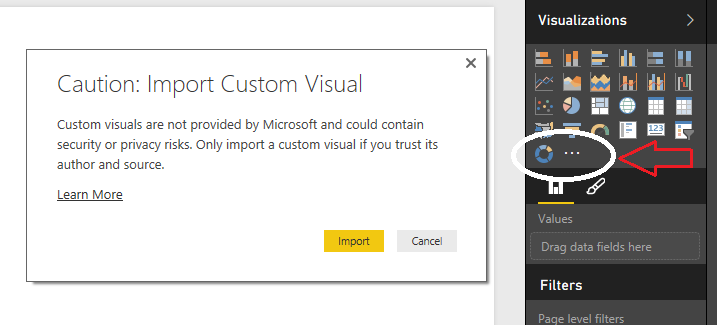
@bernardjesmith You can download all the available custom visual here. Then you can import the custom visual pbviz file directly into Power BI Desktop tool as shown in image below. You can find video tutorials on YouTube on how to use those visuals.
Check out the May 2026 Power BI update to learn about new features.
Sign up to receive a private message when registration opens and key events begin.
If you have recently started exploring Fabric, we'd love to hear how it's going. Your feedback can help with product improvements.
| User | Count |
|---|---|
| 32 | |
| 25 | |
| 24 | |
| 22 | |
| 13 |
| User | Count |
|---|---|
| 61 | |
| 47 | |
| 27 | |
| 24 | |
| 19 |