Join us at FabCon Atlanta from March 16 - 20, 2026, for the ultimate Fabric, Power BI, AI and SQL community-led event. Save $200 with code FABCOMM.
Register now!Get Fabric Certified for FREE during Fabric Data Days. Don't miss your chance! Request now
Hello all,
I am looking to create a measure that uses the ALL DAX function, but also takes into account filters that the user may explicitly filter out. Here is a quick example that I created for testing purposes:
ColorAmount
| Red | 1 |
| Blue | 2 |
| Black | 3 |
| Red | 4 |
| Blue | 5 |
| Black | 6 |
| Orange | 7 |
| Yellow | 8 |
| Green | 9 |
Using the above data I created a measure that uses the ALL function and sums the colors that do not begin with B:
Sum of Non B Colors =
CALCULATE(
SUM(Table1[Amount]),
ALL(Table1),
LEFT(Table1[Color],1) <> "B"
)
This produced the following results:
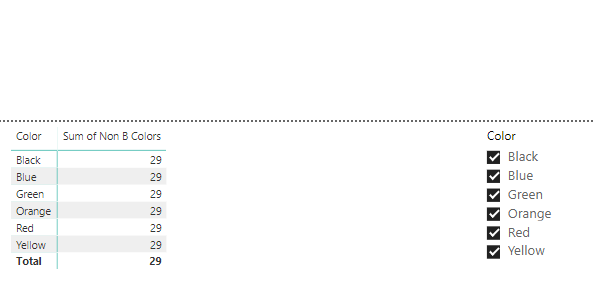
Now when I deselect Yellow, I still see the same results, this is because of the ALL function. I would like the measure to display 21 when Yellow is deselected. How can I accomplish this?
Thank you!
Solved! Go to Solution.
Hi, try with this:
SumNonBColor =
CALCULATE (
SUM ( Table1[Amount] ),
FILTER ( ALLSELECTED ( Table1[Color] ), LEFT ( Table1[Color] ) <> "B" )
)
Regards
Victor
Hi, try with this:
SumNonBColor =
CALCULATE (
SUM ( Table1[Amount] ),
FILTER ( ALLSELECTED ( Table1[Color] ), LEFT ( Table1[Color] ) <> "B" )
)
Regards
Victor
This is perfect,
Thanks.
Check out the November 2025 Power BI update to learn about new features.
Advance your Data & AI career with 50 days of live learning, contests, hands-on challenges, study groups & certifications and more!
| User | Count |
|---|---|
| 104 | |
| 81 | |
| 66 | |
| 50 | |
| 45 |