Get certified for free when you join Fabric Data Days 2026 and dive into Fabric, Power BI, SQL, AI, and other essential data skills.
Join nowJuly 7 - July 17 | Round 2 of the Power BI Dataviz World Championships. Don't miss your chance! Learn more
Hi,
I have this Table 1 structure and I need to convert it to the Table 2 structure, mainly the values for the same ID to appear on a single row, separated by ;. Do you know how this can be achieved in Power Query?
Many thanks in advance for your support!
Table 1
| ID | Value |
| 1 | a |
| 1 | b |
| 1 | c |
| 2 | x |
| 2 | y |
| 2 | z |
Table 2
| ID | Value |
| 1 | a;b;c |
| 2 | x;y;z |
Solved! Go to Solution.
let
Source = Web.BrowserContents("https://community.powerbi.com/t5/Desktop/Transform-table-structure/m-p/2250024#M818814"),
#"Extracted Table From Html" = Html.Table(Source, {{"Column1", "TABLE:nth-child(6) > * > TR > :nth-child(1)"}, {"Column2", "TABLE:nth-child(6) > * > TR > :nth-child(2)"}}, [RowSelector="TABLE:nth-child(6) > * > TR"]),
#"Promoted Headers" = Table.PromoteHeaders(#"Extracted Table From Html", [PromoteAllScalars=true]),
#"Changed Type" = Table.TransformColumnTypes(#"Promoted Headers",{{"ID", Int64.Type}, {"Value", type text}}),
#"Grouped Rows" = Table.Group(#"Changed Type", {"ID"}, {{"ad", each _, type table [ID=nullable number, Value=nullable text]}}),
#"Added Custom" = Table.AddColumn(#"Grouped Rows", "Custom", each let x=[ad],
y=x[Value]
in Text.Combine(y,":")),
#"Removed Columns" = Table.RemoveColumns(#"Added Custom",{"ad"})
in
#"Removed Columns"
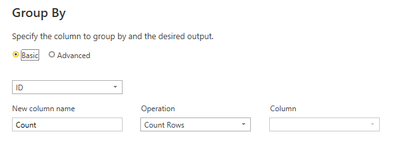
1) Group by ID (leave it on count as we will change later)
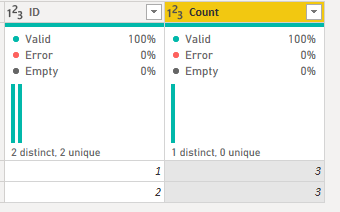
Results in:
2) Go into the advanced editor and change the line:
#"Grouped Rows" = Table.Group(#"Changed Type", {"ID"}, {{"Count", each Table.RowCount(_), Int64.Type}})
to
#"Grouped Rows" = Table.Group(#"Changed Type", {"ID"}, {{"Combined", each Text.Combine([Value], "; "), type text}})
1) Group by ID (leave it on count as we will change later)
Results in:
2) Go into the advanced editor and change the line:
#"Grouped Rows" = Table.Group(#"Changed Type", {"ID"}, {{"Count", each Table.RowCount(_), Int64.Type}})
to
#"Grouped Rows" = Table.Group(#"Changed Type", {"ID"}, {{"Combined", each Text.Combine([Value], "; "), type text}})
HI @andra2 ,
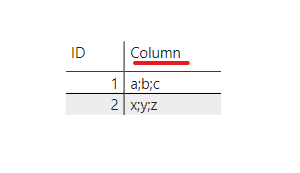
You can create a calculated column as follows:
Column =
CONCATENATEX (
FILTER (
SUMMARIZE ( Table2, Table2[ID], Table2[Value] ),
Table2[ID] = EARLIER ( Table2[ID] )
),
Table2[Value],
";"
)
This gives you required result:
Thanks,
Pragati
Hi @smpa01 ,
Curious to know if my solution is not right.
Just want to understand what stopped you from accepting it as a solution? 🙂
Thanks,
Pragati
let
Source = Web.BrowserContents("https://community.powerbi.com/t5/Desktop/Transform-table-structure/m-p/2250024#M818814"),
#"Extracted Table From Html" = Html.Table(Source, {{"Column1", "TABLE:nth-child(6) > * > TR > :nth-child(1)"}, {"Column2", "TABLE:nth-child(6) > * > TR > :nth-child(2)"}}, [RowSelector="TABLE:nth-child(6) > * > TR"]),
#"Promoted Headers" = Table.PromoteHeaders(#"Extracted Table From Html", [PromoteAllScalars=true]),
#"Changed Type" = Table.TransformColumnTypes(#"Promoted Headers",{{"ID", Int64.Type}, {"Value", type text}}),
#"Grouped Rows" = Table.Group(#"Changed Type", {"ID"}, {{"ad", each _, type table [ID=nullable number, Value=nullable text]}}),
#"Added Custom" = Table.AddColumn(#"Grouped Rows", "Custom", each let x=[ad],
y=x[Value]
in Text.Combine(y,":")),
#"Removed Columns" = Table.RemoveColumns(#"Added Custom",{"ad"})
in
#"Removed Columns"
Join us in Barcelona for FabCon and SQLCon, the Fabric, Power BI, SQL, and AI community event. Save €200 with code FABCMTY200.
If you love stickers, then you will definitely want to check out our community sticker challenge, Barcelona edition!
Check out the July 2026 Power BI update to learn about new features.
| User | Count |
|---|---|
| 29 | |
| 23 | |
| 23 | |
| 22 | |
| 14 |
| User | Count |
|---|---|
| 48 | |
| 33 | |
| 20 | |
| 18 | |
| 16 |