This is best Fabric, Power BI, SQL and AI community event. How do we know? The last event sold out! Save €200 with code FABCMTY200.
Register nowThe Fabric community is upgrading! Read all of the details including the timeline and what you can expect. Learn more
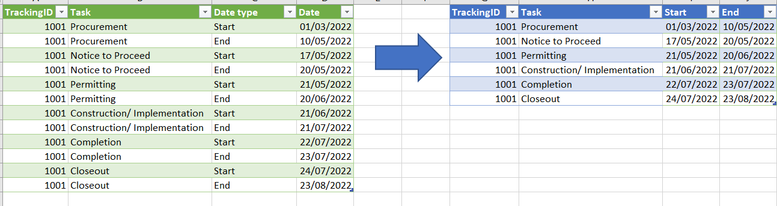
Hi! Can you help me transform the table below to show the start and end date to be the columns? Thank you! I tried transform and unpivot but I cant seem to get it.
Cheers!
Solved! Go to Solution.
Hi,
In the Query Editor, click on any cell in the Date type column and under Transform, click on the Pivot button. In the drop down, select Date. Expand the Options triangle and select Don't aggregate.
Hope this helps.
Hi,
In the Query Editor, click on any cell in the Date type column and under Transform, click on the Pivot button. In the drop down, select Date. Expand the Options triangle and select Don't aggregate.
Hope this helps.
Thank you very much! You saved me lots! 🙂
You are welcome.
@Anonymous , Pivot Date Type and Date
Join us in Barcelona for FabCon and SQLCon, the Fabric, Power BI, SQL, and AI community event. Save €200 with code FABCMTY200.
| User | Count |
|---|---|
| 24 | |
| 22 | |
| 20 | |
| 18 | |
| 14 |
| User | Count |
|---|---|
| 27 | |
| 22 | |
| 21 | |
| 20 | |
| 20 |