cancel
Showing results for 
Search instead for 
Did you mean: 

July 7 - July 17 | Round 2 of the Power BI Dataviz World Championships. Don't miss your chance! Learn more

Reply
Anonymous
Not applicable

Switch Row/Column Data

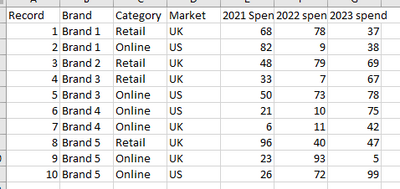
Hi, I have some data which are single record for different combinations with columns for yearly spend. Here's some mock data:


TomG1989_0-1692283488506.png


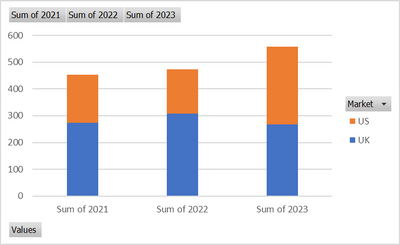
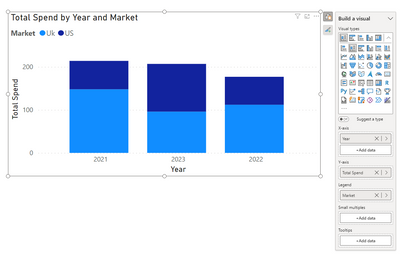
I want to be able to chart the data that each year is the X axis label then I can have the stacks as the Brand/Category/Market such as the below which I can do using a stack column and switch row/column when pivoting the data in excel.


Chart 1:

TomG1989_1-1692283582948.png


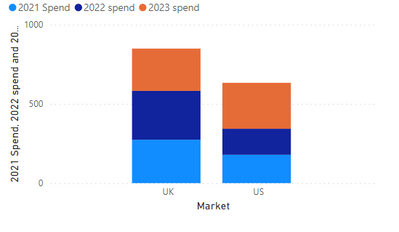
When I try to do this in power BI I can only get the following chart and can't figure out how to switch row/column


Chart 2:

TomG1989_0-1692283894303.png

Any way I can turn chart 2 into chart 1 in PowerBI?


1 ACCEPTED SOLUTION
Bmejia
Super User
Super User

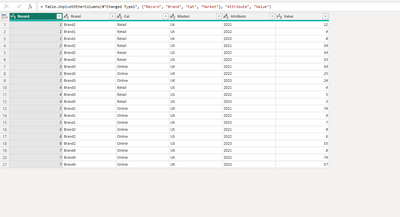
if the data you bringing  is in the same format as your table above. Then you will need to pivot the data, by going into transform data and highlight the column years and go to the transform/Unpivot columns. Your data should look something like this now.  close and apply Now you should be able to pivot the data in the format you want.

Bmejia_0-1692305746553.png

Bmejia_1-1692305857633.png


View solution in original post

1 REPLY 1
Bmejia
Super User
Super User

if the data you bringing  is in the same format as your table above. Then you will need to pivot the data, by going into transform data and highlight the column years and go to the transform/Unpivot columns. Your data should look something like this now.  close and apply Now you should be able to pivot the data in the format you want.

Bmejia_0-1692305746553.png

Bmejia_1-1692305857633.png


Helpful resources

Announcements
FabCon and SQLCon Barcelona 2026

FabCon & SQLCon – Barcelona 2026

Join us in Barcelona for FabCon and SQLCon, the Fabric, Power BI, SQL, and AI community event. Save €200 with code FABCMTY200.

60 days of Data Days Carousel

Data Days 2026

Join Fabric Data Days 2026: 60 days of free live/on-demand sessions, challenges, study groups, and certification opportunities.

Power BI DataViz World Championships carousel

Power BI DataViz World Championships - June 2026

A new Power BI DataViz World Championship is coming this June! Don't miss out on submitting your entry.