
Get certified for free when you join Fabric Data Days 2026 and dive into Fabric, Power BI, SQL, AI, and other essential data skills.
Join nowJuly 28 - August 9 | Final Round of the Power BI Dataviz World Championships. This is your chance. Learn more
Hi I saw this question in one website.
You have a Power BI report named Orders that supports the following analysis:
✑ Total sales over time
✑ The count of orders over time
✑ New and repeat customer counts
The data model size is nearing the limit for a dataset in shared capacity.
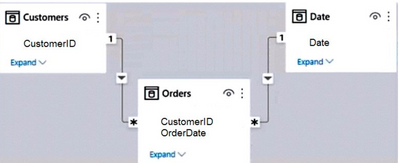
The model view for the dataset is shown in the following exhibit.
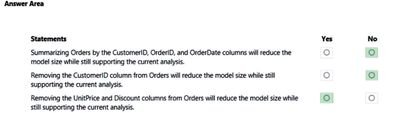
Answer :
Why is the answer No for the first option?
Hi @KV2022 ,
Is your problem solved? If so, would you mind accept the helpful replies as solutions? Then we are able to close the thread. More people who have the same requirment will find the solution quickly and benefit here, thank you!
Best Regards,
Community Support Team _ kalyj
@KV2022 ,
By summarizing the data into a single table, what you would end up with is an extra table that stores and duplicates data from your fact and dimensions. This typically would be called denormalized tables. The question indicates that your shared capacity is nearing its limit for a dataset size so adding "bloat" to your model is not recommended.
In addition, we typically like to "normalize" the model by splitting factual data, considering keys and aggregations, in one table, and attributes in dimension tables to reduce data duplication / redundancy.
If you love stickers, then you will definitely want to check out our community sticker challenge, Barcelona edition!
Check out the July 2026 Power BI update to learn about new features.
| User | Count |
|---|---|
| 28 | |
| 28 | |
| 19 | |
| 19 | |
| 19 |
| User | Count |
|---|---|
| 37 | |
| 29 | |
| 18 | |
| 17 | |
| 15 |