
This is best Fabric, Power BI, SQL and AI community event. How do we know? The last event sold out! Save €200 with code FABCMTY200.
Register nowA new Data Days event is coming soon! This time we’re going bigger than ever. Fabric, Power BI, SQL, AI and more. Don't miss out.
Hi I saw this question in one website.
You have a Power BI report named Orders that supports the following analysis:
✑ Total sales over time
✑ The count of orders over time
✑ New and repeat customer counts
The data model size is nearing the limit for a dataset in shared capacity.
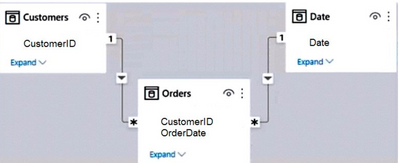
The model view for the dataset is shown in the following exhibit.
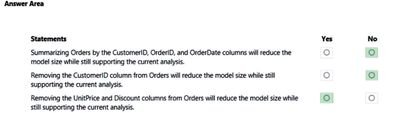
Answer :
Why is the answer No for the first option?
Hi @KV2022 ,
Is your problem solved? If so, would you mind accept the helpful replies as solutions? Then we are able to close the thread. More people who have the same requirment will find the solution quickly and benefit here, thank you!
Best Regards,
Community Support Team _ kalyj
@KV2022 ,
By summarizing the data into a single table, what you would end up with is an extra table that stores and duplicates data from your fact and dimensions. This typically would be called denormalized tables. The question indicates that your shared capacity is nearing its limit for a dataset size so adding "bloat" to your model is not recommended.
In addition, we typically like to "normalize" the model by splitting factual data, considering keys and aggregations, in one table, and attributes in dimension tables to reduce data duplication / redundancy.
Check out the May 2026 Power BI update to learn about new features.
Sign up to receive a private message when registration opens and key events begin.
If you have recently started exploring Fabric, we'd love to hear how it's going. Your feedback can help with product improvements.
| User | Count |
|---|---|
| 32 | |
| 25 | |
| 23 | |
| 22 | |
| 13 |
| User | Count |
|---|---|
| 61 | |
| 47 | |
| 27 | |
| 24 | |
| 19 |