Get certified for free when you join Fabric Data Days 2026 and dive into Fabric, Power BI, SQL, AI, and other essential data skills.
Join nowJuly 7 - July 17 | Round 2 of the Power BI Dataviz World Championships. Don't miss your chance! Learn more
Hello!
I'd like to transform this:
| Projetc | Step 1 | Step 2 | Step 3 | Step 4 | Step 5 | Step 6 |
| Project A | Completed | Completed | Completed | Completed | Pending | Pending |
| Project B | Completed | Completed | Completed | Completed | Pending | Pending |
| Project B | Completed | Completed | Completed | Completed | Pending | Pending |
| Project B | Completed | Completed | Doing | Doing | Doing | Pending |
| Project B | Completed | Completed | Completed | Pending | Pending | Pending |
| Project B | Completed | Doing | Doing | Doing | Pending | Pending |
| Project B | Completed | Doing | Doing | Pending | Pending | Pending |
| Project B | Completed | Doing | Pending | Pending | Pending | Pending |
| Project B | Completed | Completed | Completed | Completed | Pending | Pending |
| Project B | Completed | Completed | Completed | Completed | Pending | Pending |
Into this:
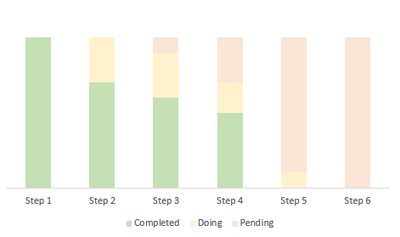
| Step | Completed | Doing | Pending |
| Step 1 | 10 | 0 | 0 |
| Step 2 | 7 | 3 | 0 |
| Step 3 | 6 | 3 | 1 |
| Step 4 | 5 | 2 | 3 |
| Step 5 | 0 | 1 | 9 |
| Step 6 | 0 | 0 | 10 |
So i can create this graph:
I must do this inside power bi, because I want to use cross filter or segmentation to change the graph if one project is selected.
Thanks!
Solved! Go to Solution.
@Anonymous you should unpivot your data by using following steps:
- transform data
- select project column in the table
- right-click, unpivot other columns it will add two columns, attribute, and value, rename these as per your requirement
- close and apply
To visualize,
- add attribute column (or renamed column) on x-axis
- value column (or renamed column) on legend,
- project on values for count or add a measure for count rows and use that on value
I would ❤ Kudos if my solution helped. 👉 If you can spend time posting the question, you can also make efforts to give Kudos whoever helped to solve your problem. It is a token of appreciation!
⚡Visit us at https://perytus.com, your one-stop shop for Power BI related projects/training/consultancy.⚡
Subscribe to the @PowerBIHowTo YT channel for an upcoming video on List and Record functions in Power Query!!
Learn Power BI and Fabric - subscribe to our YT channel - Click here: @PowerBIHowTo
If my solution proved useful, I'd be delighted to receive Kudos. When you put effort into asking a question, it's equally thoughtful to acknowledge and give Kudos to the individual who helped you solve the problem. It's a small gesture that shows appreciation and encouragement! ❤
Did I answer your question? Mark my post as a solution. Proud to be a Super User! Appreciate your Kudos 🙂
Feel free to email me with any of your BI needs.

@Anonymous you should unpivot your data by using following steps:
- transform data
- select project column in the table
- right-click, unpivot other columns it will add two columns, attribute, and value, rename these as per your requirement
- close and apply
To visualize,
- add attribute column (or renamed column) on x-axis
- value column (or renamed column) on legend,
- project on values for count or add a measure for count rows and use that on value
I would ❤ Kudos if my solution helped. 👉 If you can spend time posting the question, you can also make efforts to give Kudos whoever helped to solve your problem. It is a token of appreciation!
⚡Visit us at https://perytus.com, your one-stop shop for Power BI related projects/training/consultancy.⚡
Subscribe to the @PowerBIHowTo YT channel for an upcoming video on List and Record functions in Power Query!!
Learn Power BI and Fabric - subscribe to our YT channel - Click here: @PowerBIHowTo
If my solution proved useful, I'd be delighted to receive Kudos. When you put effort into asking a question, it's equally thoughtful to acknowledge and give Kudos to the individual who helped you solve the problem. It's a small gesture that shows appreciation and encouragement! ❤
Did I answer your question? Mark my post as a solution. Proud to be a Super User! Appreciate your Kudos 🙂
Feel free to email me with any of your BI needs.
Thanks! It worked perfectly!
Just one more configuration:
I want the "Completed" at the bottom, "Doing" in the middle and "Pending" on top of column. How do i configure this?
@Anonymous you should add another column for each value the way you want to sort it and then you can use sort by feature to sort your data.
I would ❤ Kudos if my solution helped. 👉 If you can spend time posting the question, you can also make efforts to give Kudos whoever helped to solve your problem. It is a token of appreciation!
⚡Visit us at https://perytus.com, your one-stop shop for Power BI related projects/training/consultancy.⚡
Subscribe to the @PowerBIHowTo YT channel for an upcoming video on List and Record functions in Power Query!!
Learn Power BI and Fabric - subscribe to our YT channel - Click here: @PowerBIHowTo
If my solution proved useful, I'd be delighted to receive Kudos. When you put effort into asking a question, it's equally thoughtful to acknowledge and give Kudos to the individual who helped you solve the problem. It's a small gesture that shows appreciation and encouragement! ❤
Did I answer your question? Mark my post as a solution. Proud to be a Super User! Appreciate your Kudos 🙂
Feel free to email me with any of your BI needs.
Join us in Barcelona for FabCon and SQLCon, the Fabric, Power BI, SQL, and AI community event. Save €200 with code FABCMTY200.
Join Data Days 2026: 60 days of free live/on-demand sessions, challenges, study groups, and certification opportunities.
| User | Count |
|---|---|
| 28 | |
| 23 | |
| 18 | |
| 18 | |
| 15 |
| User | Count |
|---|---|
| 47 | |
| 44 | |
| 43 | |
| 35 | |
| 32 |