Get certified for free when you join Fabric Data Days 2026 and dive into Fabric, Power BI, SQL, AI, and other essential data skills.
Join nowJuly 28 - August 9 | Final Round of the Power BI Dataviz World Championships. This is your chance. Learn more
Hi Team,
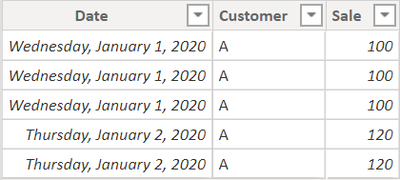
I have the following data.
I want to create a measure that calculates Customer A's sale as 100 when user selects Jan 1 on slicer and 220 if user selects date range between 1st and 2nd Jan.
I tried taking the sum of averages, but it didn't work.
Please help me on this.
Regards,
Jos
Solved! Go to Solution.
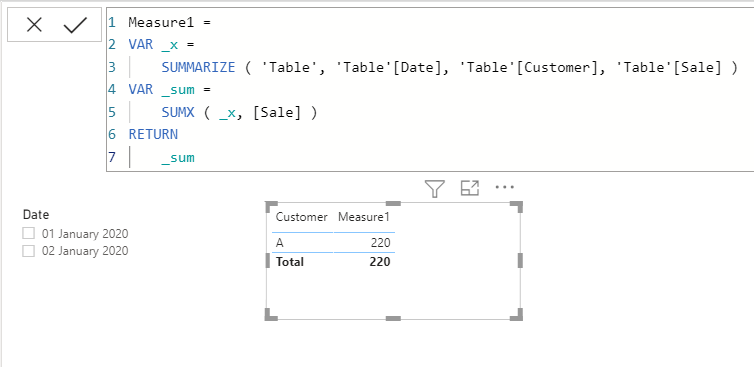
Try the below DAX measure.
Measure1 =
VAR _x =
SUMMARIZE ( 'Table', 'Table'[Date], 'Table'[Customer], 'Table'[Sale] )
VAR _sum =
SUMX ( _x, [Sale] )
RETURN
_sum
Proud to be a Super User!
that solution worked for me, it's very good, and it's the equivalence of "DISTINCT" in SQL
Try the below DAX measure.
Measure1 =
VAR _x =
SUMMARIZE ( 'Table', 'Table'[Date], 'Table'[Customer], 'Table'[Sale] )
VAR _sum =
SUMX ( _x, [Sale] )
RETURN
_sum
Proud to be a Super User!
If you love stickers, then you will definitely want to check out our community sticker challenge, Barcelona edition!
Check out the July 2026 Power BI update to learn about new features.
| User | Count |
|---|---|
| 30 | |
| 28 | |
| 23 | |
| 21 | |
| 19 |
| User | Count |
|---|---|
| 39 | |
| 31 | |
| 18 | |
| 17 | |
| 15 |