Get certified for free when you join Fabric Data Days 2026 and dive into Fabric, Power BI, SQL, AI, and other essential data skills.
Join nowJuly 7 - July 17 | Round 2 of the Power BI Dataviz World Championships. Don't miss your chance! Learn more
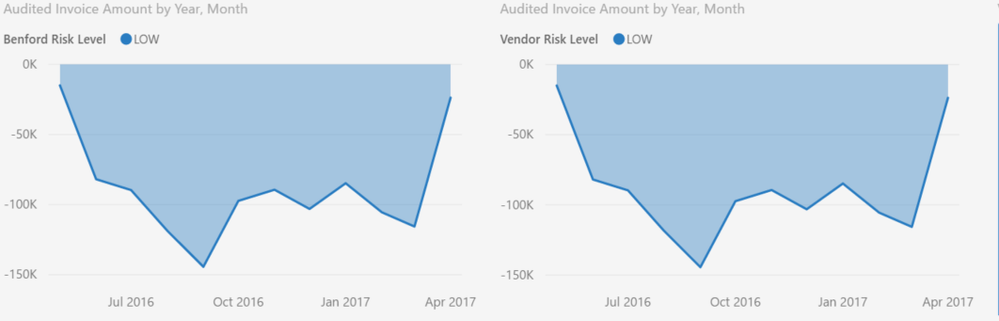
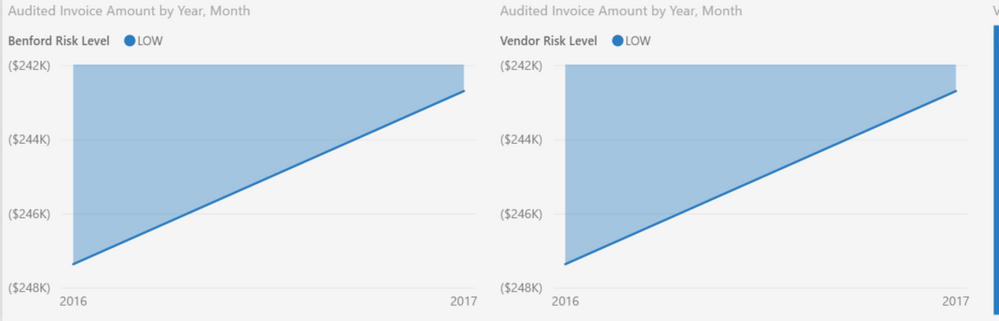
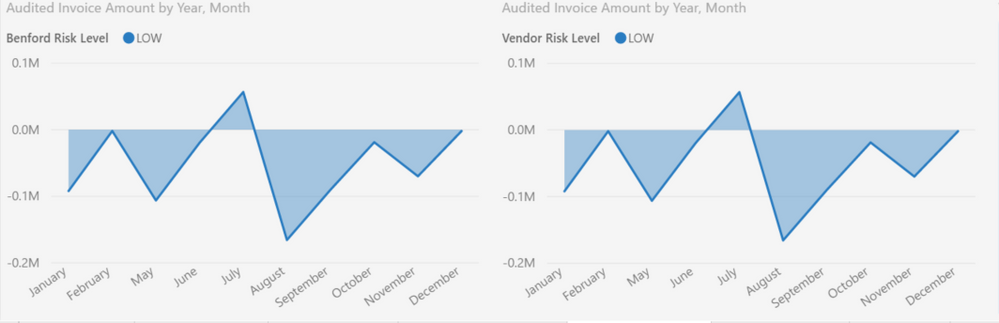
I am fairly new to Power BI having taken over for our "expert" who decided to leave the company. I am going through the file verifying filters, format, etc The Stacked Area Charts are driving me crazy! All are configured the same, similar underlying data. I *want* MONTH-YEAR to be displayed. There are 2 charts side by side on each page & sometimes I can simply delete, copy the correct one & edit it so the I have 2 displaying correctly. Then I have the pages/charts that just do not want to co-operate. Suggestions anyone?
Kris
Desired - MMM-YYYY
Displaying year only
Displaying month only
Solved! Go to Solution.
@KrisW,
What field do you drag to the X-Axis of these charts and which table does the field come from? If you only want Month-Year to be displayed, you can create a MonthYear calculated column in the table, then drag it to X-Axis of your charts,
Regards,
Lydia
@KrisW,
What field do you drag to the X-Axis of these charts and which table does the field come from? If you only want Month-Year to be displayed, you can create a MonthYear calculated column in the table, then drag it to X-Axis of your charts,
Regards,
Lydia
I am using a "transaction date" field, displaying hierarchy for year & month. I am begining to think that a calculated character field might be the only means of achieving consistancy in the display. Just a tad resentful that I might have to re-write the code generating nearly 50 reports to add the column for Power BI.
I also noted that quarters seemed to be assumed according to calendar year, I might need to add a calculated field for that as well.
Join us in Barcelona for FabCon and SQLCon, the Fabric, Power BI, SQL, and AI community event. Save โฌ200 with code FABCMTY200.
Join Data Days 2026: 60 days of free live/on-demand sessions, challenges, study groups, and certification opportunities.
| User | Count |
|---|---|
| 29 | |
| 27 | |
| 26 | |
| 24 | |
| 16 |
| User | Count |
|---|---|
| 53 | |
| 47 | |
| 38 | |
| 30 | |
| 21 |