cancel
Showing results for 
Search instead for 
Did you mean: 

July 28 - August 9 | Final Round of the Power BI Dataviz World Championships. This is your chance. Learn more

Reply
alext89
New Member

Scatter Chart Query

Hi There, 


I have loaded a CSV into Power BI desktop. Each of the KPI's are a different row in the CSV however that means all the values are in the same column, so when i go to plot a scatter chart i cant plot one of the KPI's against another. I thought there might be a way to have different filters for the x and y axis but i cant seem to find it. Anyone got any ideas? 


Cheers

3 REPLIES 3
v-huizhn-msft
Microsoft Employee
Microsoft Employee

Hi @alext89,

>> Each of the KPI's are a different row in the CSV however that means all the values are in the same column.

It's confusng, in your resource data table, there must have many different rows in one column, when you load it into Power BI desktop, there are still in one column. Why you said "all the values are in the same column", they should not in one column?

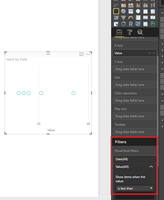
When you create a scatter chart, you can filter the value by "visual level filters" highlighted in red line.

1.PNG


Best Regards,
Aneglia

yes the CSV is set out like this:


MonthMetricValue
JanMetric 13
JanMetric 24
JanMetric 32
FebMetric 15
FebMetric 22
FebMetric 34
MarMetric 11
MarMetric 24
MarMetric 32


I want to be able to plot for example metric 2 as the x axis and metric 1 as the y axis for each month. Does that make more sense?

Hi @alext89,

As I testet, it we are unable to get what you want. It makes no sense in PowerBI visual.

Thanks,
Angelia

Helpful resources

Announcements
FabCon and SQLCon Barcelona 2026

FabCon & SQLCon – Barcelona 2026

Join us in Barcelona for FabCon and SQLCon, the Fabric, Power BI, SQL, and AI community event. Save €200 with code FABCMTY200.

Fabric Community Sticker Design Challenge Barcelona Carousel

Fabric Community Sticker Challenge - Barcelona 2026

If you love stickers, then you will definitely want to check out our community sticker challenge, Barcelona edition!

July Power BI Update Carousel

Power BI Monthly Update - July 2026

Check out the July 2026 Power BI update to learn about new features.

Power BI DataViz World Championships carousel

Power BI DataViz World Championships - June 2026

A new Power BI DataViz World Championship is coming this June! Don't miss out on submitting your entry.