Get Fabric or SQL Certified for Free.
Get certified for free when you join Fabric Data Days 2026 and dive into Fabric, Power BI, SQL, AI, and other essential data skills.
Join now- Power BI forums
- Get Help with Power BI
- Desktop
- Service
- Report Server
- Power Query
- Mobile Apps
- Developer
- DAX Commands and Tips
- Custom Visuals Development Discussion
- Health and Life Sciences
- Power BI Spanish forums
- Translated Spanish Desktop
- Training and Consulting
- Instructor Led Training
- Dashboard in a Day for Women, by Women
- Galleries
- Data Stories Gallery
- Themes Gallery
- Contests Gallery
- QuickViz Gallery
- Quick Measures Gallery
- Visual Calculations Gallery
- Notebook Gallery
- Translytical Task Flow Gallery
- TMDL Gallery
- R Script Showcase
- Webinars and Video Gallery
- Ideas
- Custom Visuals Ideas (read-only)
- Issues
- Issues
- Events
- Upcoming Events
July 7 - July 17 | Round 2 of the Power BI Dataviz World Championships. Don't miss your chance! Learn more
- Power BI forums
- Forums
- Get Help with Power BI
- Desktop
- Replicating a Graph from Excel
- Subscribe to RSS Feed
- Mark Topic as New
- Mark Topic as Read
- Float this Topic for Current User
- Bookmark
- Subscribe
- Printer Friendly Page


- Mark as New
- Bookmark
- Subscribe
- Mute
- Subscribe to RSS Feed
- Permalink
- Report Inappropriate Content
Replicating a Graph from Excel
Hi
I need help reproducing a graph I have in Excel in Powe BI and have been trying to write a measure to use in graphs
It calculates how many desk were utilised (at least once in the day) or never utilised on a giving day. Where the data is recorded every hour (Slots)
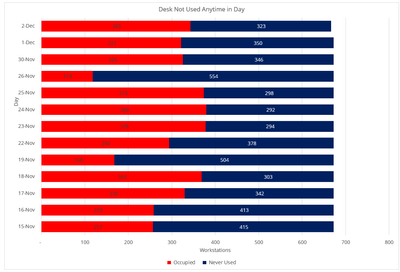
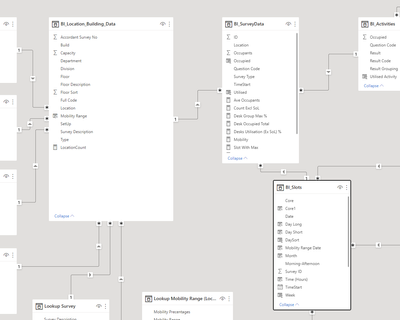
I have 3 Tables that are linked
BI_Location_Building_Data (A list of all location (Desks))
- Location
- Building
- Floor
- Department
BI_Slots
- Date Calculated from Time Start 14/03/2001
- TimeStart(Slots) Sample 14/03/2001 12:00
- 14/03/2001 13:00
- 14/03/2001 14:00
- 14/03/2001 15:00
- 14/03/2001 16:00
BI_SurveyData
- ID Autonumber
- Location
- Utilised 1 or 0
Can anyone help
Solved! Go to Solution.
- Mark as New
- Bookmark
- Subscribe
- Mute
- Subscribe to RSS Feed
- Permalink
- Report Inappropriate Content
Hi
Thanks cracked it hsed need to add a filter


- Mark as New
- Bookmark
- Subscribe
- Mute
- Subscribe to RSS Feed
- Permalink
- Report Inappropriate Content
Hi @flemingg62 ,
Do you have a specific question that we can answer? You should be able to achieve this using a 100% Stacked Bar Chart.
https://powerbidocs.com/2020/01/25/power-bi-100-stacked-bar-chart/
- Mark as New
- Bookmark
- Subscribe
- Mute
- Subscribe to RSS Feed
- Permalink
- Report Inappropriate Content
Hi
Thanks, but I need a measure to count the numner of locations never used on each day

- Mark as New
- Bookmark
- Subscribe
- Mute
- Subscribe to RSS Feed
- Permalink
- Report Inappropriate Content
Something along the lines of:
Never used =
VAR _Used =
    DISTINCTCOUNT ( Table[Locations] )
VAR _ALL =
    CALCULATE ( DISTINCTCOUNT ( Table[Locations), ALL(Table[Locations] ) )
RETURN
    _ALL - _Used
Did I answer your question? Mark my post as a solution!
In doing so, you are also helping me. Thank you!
Proud to be a Super User!
Paul on Linkedin.
- Mark as New
- Bookmark
- Subscribe
- Mute
- Subscribe to RSS Feed
- Permalink
- Report Inappropriate Content
Hi - Thanks
Been paying around with it for a few hours and no luck, but almost there, the send part is returning the correct values, but the first part needs to be limited to desks never used in a day
Never used =
VAR _Used =
DISTINCTCOUNT ( Table[Locations] ) I need to add a condition so that the values is limited to Location never used on a day, such as FILTER(SUM(BI_SurveyData(Utilised] =0)) I have tried may variation but no luck
VAR _ALL =
CALCULATE ( DISTINCTCOUNT ( Table[Locations), ALL(Table[Locations] ) )
RETURN
_ALL - _Used
I also have a measure, but no luck using this as well
Utilised Count = Sum((BI_SurveyData[Utilised]))
- Mark as New
- Bookmark
- Subscribe
- Mute
- Subscribe to RSS Feed
- Permalink
- Report Inappropriate Content
Can you share some dummy data or a link to a dummy PBIX file?
Did I answer your question? Mark my post as a solution!
In doing so, you are also helping me. Thank you!
Proud to be a Super User!
Paul on Linkedin.
- Mark as New
- Bookmark
- Subscribe
- Mute
- Subscribe to RSS Feed
- Permalink
- Report Inappropriate Content
Hi
Thanks cracked it hsed need to add a filter

Helpful resources

FabCon & SQLCon – Barcelona 2026
Join us in Barcelona for FabCon and SQLCon, the Fabric, Power BI, SQL, and AI community event. Save €200 with code FABCMTY200.

Data Days 2026
Join Data Days 2026: 60 days of free live/on-demand sessions, challenges, study groups, and certification opportunities.

Power BI DataViz World Championships - June 2026
A new Power BI DataViz World Championship is coming this June! Don't miss out on submitting your entry.

| User | Count |
|---|---|
| 27 | |
| 23 | |
| 18 | |
| 16 | |
| 15 |


| User | Count |
|---|---|
| 63 | |
| 44 | |
| 42 | |
| 37 | |
| 37 |


