Fabric Data Days starts November 4th!
Advance your Data & AI career with 50 days of live learning, dataviz contests, hands-on challenges, study groups & certifications and more!
Get registered- Power BI forums
- Get Help with Power BI
- Desktop
- Service
- Report Server
- Power Query
- Mobile Apps
- Developer
- DAX Commands and Tips
- Custom Visuals Development Discussion
- Health and Life Sciences
- Power BI Spanish forums
- Translated Spanish Desktop
- Training and Consulting
- Instructor Led Training
- Dashboard in a Day for Women, by Women
- Galleries
- Data Stories Gallery
- Themes Gallery
- Contests Gallery
- QuickViz Gallery
- Quick Measures Gallery
- Visual Calculations Gallery
- Notebook Gallery
- Translytical Task Flow Gallery
- TMDL Gallery
- R Script Showcase
- Webinars and Video Gallery
- Ideas
- Custom Visuals Ideas (read-only)
- Issues
- Issues
- Events
- Upcoming Events
Get Fabric Certified for FREE during Fabric Data Days. Don't miss your chance! Request now
- Power BI forums
- Forums
- Get Help with Power BI
- Desktop
- Re: Reorder rows
- Subscribe to RSS Feed
- Mark Topic as New
- Mark Topic as Read
- Float this Topic for Current User
- Bookmark
- Subscribe
- Printer Friendly Page
- Mark as New
- Bookmark
- Subscribe
- Mute
- Subscribe to RSS Feed
- Permalink
- Report Inappropriate Content
Reorder rows
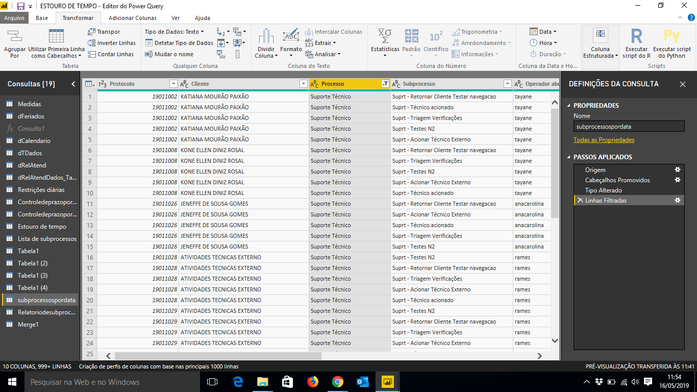
Good Morning, I have a database where the protocol number is repeated in multiple lines according to the subprocesses of the service, so I would like each protocol to appear in only one line and its processes be shown in different columns. How can I do this
Solved! Go to Solution.
- Mark as New
- Bookmark
- Subscribe
- Mute
- Subscribe to RSS Feed
- Permalink
- Report Inappropriate Content
Try this:
let
    Source = Excel.Workbook(File.Contents("C:\Users\rlosurdo\Desktop\SampleData_Process.xlsx"), null, true),
    Process_Sheet = Source{[Item="Process",Kind="Sheet"]}[Data],
    #"Promoted Headers" = Table.PromoteHeaders(Process_Sheet, [PromoteAllScalars=true]),
    #"Changed Type" = Table.TransformColumnTypes(#"Promoted Headers",{{"Protocol", Int64.Type}, {"Client", type text}, {"Process", type text}, {"Sub-process", type text}}),
    #"Grouped Rows" = Table.Group(#"Changed Type", {"Protocol"}, {{"All", each Table.AddIndexColumn(_, "Sub-processQty",1,1)}}, GroupKind.Local),
    #"Expanded All" = Table.ExpandTableColumn(#"Grouped Rows", "All", {"Client", "Process", "Sub-process", "Sub-processQty"}, {"Client", "Process", "Sub-process", "Sub-processQty"}),
    #"Added Custom" = Table.AddColumn(#"Expanded All", "ColumnHeaders", each "Sub-process #" & Number.ToText([#"Sub-processQty"])),
    #"Removed Columns" = Table.RemoveColumns(#"Added Custom",{"Sub-processQty"}),
    #"Pivoted Column" = Table.Pivot(#"Removed Columns", List.Distinct(#"Removed Columns"[ColumnHeaders]), "ColumnHeaders", "Sub-process")
in
#"Pivoted Column"- Mark as New
- Bookmark
- Subscribe
- Mute
- Subscribe to RSS Feed
- Permalink
- Report Inappropriate Content
Hi @adriano321souza,
Can you confirm that what you're looking for is to have a column header for each possible sub-process? If that is the case, the intersections between each row (protocol number) and each sub-process column would show a binary TRUE-FALSE value depending on whether that protocol had that sub-process:
Let me know if that's what you'd like or if you're looking for something else.
- Mark as New
- Bookmark
- Subscribe
- Mute
- Subscribe to RSS Feed
- Permalink
- Report Inappropriate Content
Hello,
@BekahLoSurdo wrote:Hi @adriano321souza,
Can you confirm that what you're looking for is to have a column header for each possible sub-process? If that is the case, the intersections between each row (protocol number) and each sub-process column would show a binary TRUE-FALSE value depending on whether that protocol had that sub-process:
Let me know if that's what you'd like or if you're looking for something else.
the subprocesses should appear in the same line as the protocol and the client.
- Mark as New
- Bookmark
- Subscribe
- Mute
- Subscribe to RSS Feed
- Permalink
- Report Inappropriate Content
Try this:
let
    Source = Excel.Workbook(File.Contents("C:\Users\rlosurdo\Desktop\SampleData_Process.xlsx"), null, true),
    Process_Sheet = Source{[Item="Process",Kind="Sheet"]}[Data],
    #"Promoted Headers" = Table.PromoteHeaders(Process_Sheet, [PromoteAllScalars=true]),
    #"Changed Type" = Table.TransformColumnTypes(#"Promoted Headers",{{"Protocol", Int64.Type}, {"Client", type text}, {"Process", type text}, {"Sub-process", type text}}),
    #"Grouped Rows" = Table.Group(#"Changed Type", {"Protocol"}, {{"All", each Table.AddIndexColumn(_, "Sub-processQty",1,1)}}, GroupKind.Local),
    #"Expanded All" = Table.ExpandTableColumn(#"Grouped Rows", "All", {"Client", "Process", "Sub-process", "Sub-processQty"}, {"Client", "Process", "Sub-process", "Sub-processQty"}),
    #"Added Custom" = Table.AddColumn(#"Expanded All", "ColumnHeaders", each "Sub-process #" & Number.ToText([#"Sub-processQty"])),
    #"Removed Columns" = Table.RemoveColumns(#"Added Custom",{"Sub-processQty"}),
    #"Pivoted Column" = Table.Pivot(#"Removed Columns", List.Distinct(#"Removed Columns"[ColumnHeaders]), "ColumnHeaders", "Sub-process")
in
#"Pivoted Column"- Mark as New
- Bookmark
- Subscribe
- Mute
- Subscribe to RSS Feed
- Permalink
- Report Inappropriate Content
Helpful resources

Power BI Monthly Update - November 2025
Check out the November 2025 Power BI update to learn about new features.

Fabric Data Days
Advance your Data & AI career with 50 days of live learning, contests, hands-on challenges, study groups & certifications and more!

| User | Count |
|---|---|
| 97 | |
| 74 | |
| 50 | |
| 49 | |
| 44 |


