Get Fabric or SQL Certified for Free.
Get certified for free when you join Fabric Data Days 2026 and dive into Fabric, Power BI, SQL, AI, and other essential data skills.
Join now- Power BI forums
- Get Help with Power BI
- Desktop
- Service
- Report Server
- Power Query
- Mobile Apps
- Developer
- DAX Commands and Tips
- Custom Visuals Development Discussion
- Health and Life Sciences
- Power BI Spanish forums
- Translated Spanish Desktop
- Training and Consulting
- Instructor Led Training
- Dashboard in a Day for Women, by Women
- Galleries
- Data Stories Gallery
- Themes Gallery
- Contests Gallery
- QuickViz Gallery
- Quick Measures Gallery
- Visual Calculations Gallery
- Fabric Apps Gallery
- Notebook Gallery
- Translytical Task Flow Gallery
- TMDL Gallery
- R Script Showcase
- Webinars and Video Gallery
- Ideas
- Custom Visuals Ideas (read-only)
- Issues
- Issues
- Events
- Upcoming Events
July 7 - July 17 | Round 2 of the Power BI Dataviz World Championships. Don't miss your chance! Learn more
- Power BI forums
- Forums
- Get Help with Power BI
- Desktop
- Re: Rank with multiple fields
- Subscribe to RSS Feed
- Mark Topic as New
- Mark Topic as Read
- Float this Topic for Current User
- Bookmark
- Subscribe
- Printer Friendly Page

- Mark as New
- Bookmark
- Subscribe
- Mute
- Subscribe to RSS Feed
- Permalink
- Report Inappropriate Content
Rank with multiple fields
I have a ranking problem. I need to rank results by alias, ordered by orderid
Positive Result Reporting Table =
SUMMARIZE( Data_File,
Data_File[RESULT ],
Data_File[ALIAS ],
Data_File[ORDERID ],
Data_File[CE_RESOURCE ],
"Test Order",RANKX(ALL( Data_File[ALIAS ], Data_File[CE_RESOURCE ], Data_File[RESULT ]),SUMX( Data_File, Data_File[ORDERQTY ]), Data_File[ORDERID ],ASC,Dense))
yields:
ALIAS CE_RESOURCE ORDERID RESULT Test Order
274 CL Mole cobas 8800-1 483 Not Detected 2
274 CL Mole cobas 8800-1 473 Not Detected 2
274 CL Mole cobas 8800-1 463 Not Detected 2
Expected result:
ALIAS CE_RESOURCE ORDERID RESULT Test Order
274 CL Mole cobas 8800-1 483 Not Detected 1
274 CL Mole cobas 8800-1 473 Not Detected 2
274 CL Mole cobas 8800-1 463 Not Detected 3
What am I doing wrong?
Solved! Go to Solution.


- Mark as New
- Bookmark
- Subscribe
- Mute
- Subscribe to RSS Feed
- Permalink
- Report Inappropriate Content
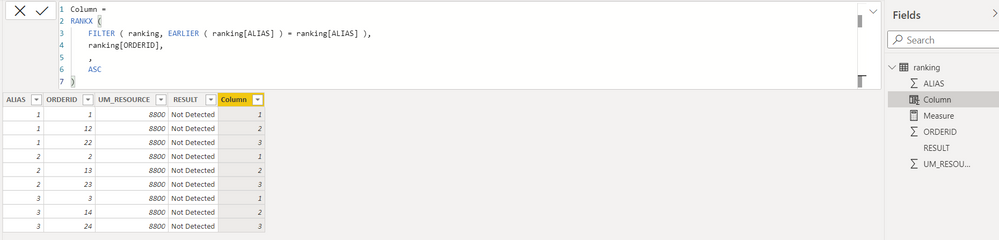
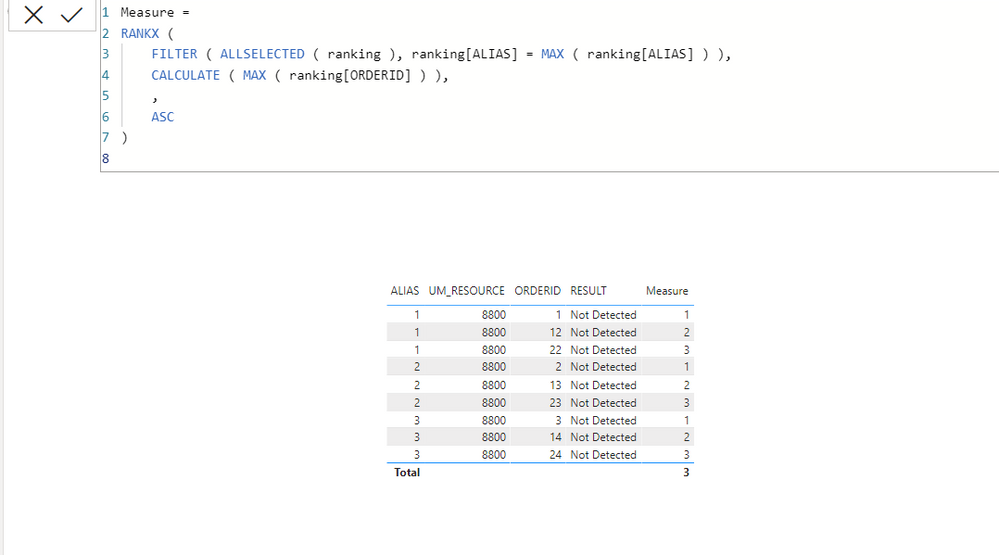
@nutmegsnot sure if you want a calculated column or a measure, so did both.
Column =
RANKX (
    FILTER ( ranking, EARLIER ( ranking[ALIAS] ) = ranking[ALIAS] ),
    ranking[ORDERID],
    ,
    ASC
)

Measure:=
RANKX (
    FILTER ( ALLSELECTED ( ranking ), ranking[ALIAS] = MAX ( ranking[ALIAS] ) ),
    CALCULATE ( MAX ( ranking[ORDERID] ) ),
    ,
    ASC
)
========================
Did I answer your question? Mark my post as a solution!
Proud to be a Super User
My Custom Visualization Projects
• Plotting Live Sound: Live Sound
• Beautiful News: Women in Parliament, Energy Mix, Shrinking Armies
• Visual Capitalist: Working Hrs
• Others: Easing Graph, Animated Calendar
MayViz Submissions
• Week 1: View
• Week 2: View
• Week 3: View
• Week 4: View
========================
- Mark as New
- Bookmark
- Subscribe
- Mute
- Subscribe to RSS Feed
- Permalink
- Report Inappropriate Content
Measure =
RANKX (
    FILTER (
        ALLSELECTED ( 'rank' ),
        'rank'[ALIAS] = MAX ( 'rank'[ALIAS] )
            && 'rank'[TestDate] = MAX ( 'rank'[TestDate] )
    ),
    CALCULATE ( MAX ( 'rank'[ORDERID] ) ),
    ,
    ASC
)
========================
Did I answer your question? Mark my post as a solution!
Proud to be a Super User
My Custom Visualization Projects
• Plotting Live Sound: Live Sound
• Beautiful News: Women in Parliament, Energy Mix, Shrinking Armies
• Visual Capitalist: Working Hrs
• Others: Easing Graph, Animated Calendar
MayViz Submissions
• Week 1: View
• Week 2: View
• Week 3: View
• Week 4: View
========================

- Mark as New
- Bookmark
- Subscribe
- Mute
- Subscribe to RSS Feed
- Permalink
- Report Inappropriate Content
Hi @nutmegs ,
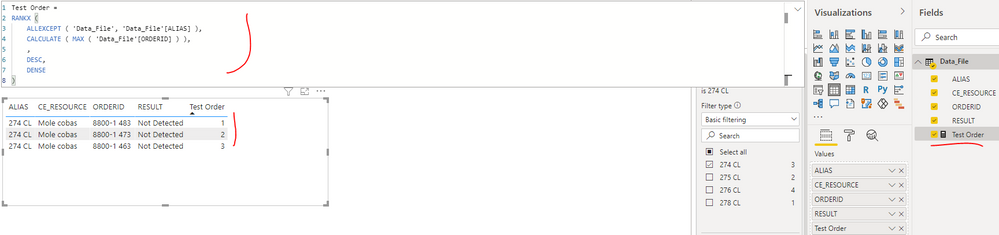
You can create a measure as below:
Test Order =
RANKX (
    ALLEXCEPT ( 'Data_File', 'Data_File'[ALIAS] ),
    CALCULATE ( MAX ( 'Data_File'[ORDERID] ) ),
    ,
    DESC,
    DENSE
)
Best Regards
- Mark as New
- Bookmark
- Subscribe
- Mute
- Subscribe to RSS Feed
- Permalink
- Report Inappropriate Content
@nutmegscan you give a sample data for Data_File?
========================
Did I answer your question? Mark my post as a solution!
Proud to be a Super User
My Custom Visualization Projects
• Plotting Live Sound: Live Sound
• Beautiful News: Women in Parliament, Energy Mix, Shrinking Armies
• Visual Capitalist: Working Hrs
• Others: Easing Graph, Animated Calendar
MayViz Submissions
• Week 1: View
• Week 2: View
• Week 3: View
• Week 4: View
========================
- Mark as New
- Bookmark
- Subscribe
- Mute
- Subscribe to RSS Feed
- Permalink
- Report Inappropriate Content
Unlike Tableau I can't attach anything. I am going to paste the data from a sample csv. Just paste it into notepad and save as csv. The Test Order field is the calculated field (rank) based on the order of the orderids grouped by alias. I am attaching what I want to see (Test order is ranked 1,2,3 for each of these alias)
ALIAS,ORDERID,UM_RESOURCE,RESULT,Test Order
1,1,8800,Not Detected,1
1,12,8800,Not Detected,2
1,22,8800,Not Detected,3
2,2,8800,Not Detected,1
2,13,8800,Not Detected,2
2,23,8800,Not Detected,3
3,3,8800,Not Detected,1
3,14,8800,Not Detected,2
3,24,8800,Not Detected,3
- Mark as New
- Bookmark
- Subscribe
- Mute
- Subscribe to RSS Feed
- Permalink
- Report Inappropriate Content
@nutmegsnot sure if you want a calculated column or a measure, so did both.
Column =
RANKX (
    FILTER ( ranking, EARLIER ( ranking[ALIAS] ) = ranking[ALIAS] ),
    ranking[ORDERID],
    ,
    ASC
)

Measure:=
RANKX (
    FILTER ( ALLSELECTED ( ranking ), ranking[ALIAS] = MAX ( ranking[ALIAS] ) ),
    CALCULATE ( MAX ( ranking[ORDERID] ) ),
    ,
    ASC
)
========================
Did I answer your question? Mark my post as a solution!
Proud to be a Super User
My Custom Visualization Projects
• Plotting Live Sound: Live Sound
• Beautiful News: Women in Parliament, Energy Mix, Shrinking Armies
• Visual Capitalist: Working Hrs
• Others: Easing Graph, Animated Calendar
MayViz Submissions
• Week 1: View
• Week 2: View
• Week 3: View
• Week 4: View
========================
- Mark as New
- Bookmark
- Subscribe
- Mute
- Subscribe to RSS Feed
- Permalink
- Report Inappropriate Content
OK. So the meaure works, but I actually need them ranked by date and alias. I've attached the data for a csv that has the expected result with a new date field.
ALIAS,ORDERID,UM_RESOURCE,RESULT,TestDate,Test Order
1,1,8800,Not Detected,1/1/2021,1
1,12,8800,Not Detected,1/2/2021,1
1,22,8800,Not Detected,1/2/2021,2
2,2,8800,Not Detected,1/4/2021,1
2,13,8800,Not Detected,1/5/2021,2
2,23,8800,Not Detected,1/6/2021,3
3,3,8800,Not Detected,1/7/2021,1
3,14,8800,Not Detected,1/7/2021,2
3,24,8800,Not Detected,1/8/2021,1
This picture is an example of what I want the Test Order measure to produce.
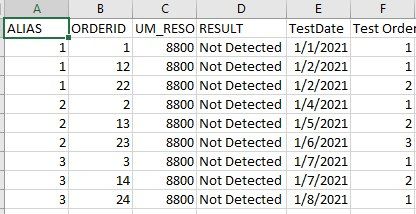
I tried this and it did not produce the expected result.
Test Order = calculate (RANKX (
FILTER ( ALLSELECTED ( 'Positive Result Reporting Table' ), 'Positive Result Reporting Table'[ALIAS] = MAX ( 'Positive Result Reporting Table'[ALIAS]) ),
CALCULATE ( MAX ( 'Positive Result Reporting Table'[ORDERID] ) ),
,
ASC
) , ALLEXCEPT('Positive Result Reporting Table','Positive Result Reporting Table'[TestDate]))
- Mark as New
- Bookmark
- Subscribe
- Mute
- Subscribe to RSS Feed
- Permalink
- Report Inappropriate Content
Measure =
RANKX (
    FILTER (
        ALLSELECTED ( 'rank' ),
        'rank'[ALIAS] = MAX ( 'rank'[ALIAS] )
            && 'rank'[TestDate] = MAX ( 'rank'[TestDate] )
    ),
    CALCULATE ( MAX ( 'rank'[ORDERID] ) ),
    ,
    ASC
)
========================
Did I answer your question? Mark my post as a solution!
Proud to be a Super User
My Custom Visualization Projects
• Plotting Live Sound: Live Sound
• Beautiful News: Women in Parliament, Energy Mix, Shrinking Armies
• Visual Capitalist: Working Hrs
• Others: Easing Graph, Animated Calendar
MayViz Submissions
• Week 1: View
• Week 2: View
• Week 3: View
• Week 4: View
========================
Helpful resources

FabCon & SQLCon – Barcelona 2026
Join us in Barcelona for FabCon and SQLCon, the Fabric, Power BI, SQL, and AI community event. Save €200 with code FABCMTY200.

Power BI Monthly Update - July 2026
Check out the July 2026 Power BI update to learn about new features.

Data Days 2026
Join Data Days 2026: 60 days of free live/on-demand sessions, challenges, study groups, and certification opportunities.

Power BI DataViz World Championships - June 2026
A new Power BI DataViz World Championship is coming this June! Don't miss out on submitting your entry.

| User | Count |
|---|---|
| 29 | |
| 23 | |
| 23 | |
| 22 | |
| 14 |


| User | Count |
|---|---|
| 48 | |
| 32 | |
| 19 | |
| 18 | |
| 16 |


