Join the Fabric User Panel to shape the future of Fabric.
Share feedback directly with Fabric product managers, participate in targeted research studies and influence the Fabric roadmap.
Sign up now- Power BI forums
- Get Help with Power BI
- Desktop
- Service
- Report Server
- Power Query
- Mobile Apps
- Developer
- DAX Commands and Tips
- Custom Visuals Development Discussion
- Health and Life Sciences
- Power BI Spanish forums
- Translated Spanish Desktop
- Training and Consulting
- Instructor Led Training
- Dashboard in a Day for Women, by Women
- Galleries
- Data Stories Gallery
- Themes Gallery
- Contests Gallery
- QuickViz Gallery
- Quick Measures Gallery
- Visual Calculations Gallery
- Notebook Gallery
- Translytical Task Flow Gallery
- TMDL Gallery
- R Script Showcase
- Webinars and Video Gallery
- Ideas
- Custom Visuals Ideas (read-only)
- Issues
- Issues
- Events
- Upcoming Events
Get Fabric certified for FREE! Don't miss your chance! Learn more
- Power BI forums
- Forums
- Get Help with Power BI
- Desktop
- Re: Problem with Applying Slicer/Filter
- Subscribe to RSS Feed
- Mark Topic as New
- Mark Topic as Read
- Float this Topic for Current User
- Bookmark
- Subscribe
- Printer Friendly Page
- Mark as New
- Bookmark
- Subscribe
- Mute
- Subscribe to RSS Feed
- Permalink
- Report Inappropriate Content
Problem with Applying Slicer/Filter
Hello,
Guys I have the follwoing problems which I hope you will help me solving it.
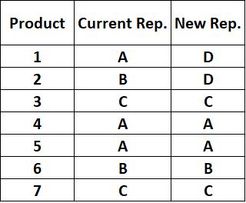
I want to create a page slicer/filter for Rep. to compare how many products each rep. is handling based on current and new plan.Thus, I want to create two tables on the same page with a slice..The first table will represent the current plane and the other table will represent the new plan....something like this:
As you can noticed Rep. "D" is not available in current plan...my question is how can I create one slice/filter with all rep names that will filter both tables correctly.for example in case I select Rep. "D",the current plan table will show nothing while the new plan table will show D = 2 products.
Thanks in advance.
Solved! Go to Solution.
- Mark as New
- Bookmark
- Subscribe
- Mute
- Subscribe to RSS Feed
- Permalink
- Report Inappropriate Content
@AZL solution attached, everything is done in edit query.
Subscribe to the @PowerBIHowTo YT channel for an upcoming video on List and Record functions in Power Query!!
Learn Power BI and Fabric - subscribe to our YT channel - Click here: @PowerBIHowTo
If my solution proved useful, I'd be delighted to receive Kudos. When you put effort into asking a question, it's equally thoughtful to acknowledge and give Kudos to the individual who helped you solve the problem. It's a small gesture that shows appreciation and encouragement! ❤
Did I answer your question? Mark my post as a solution. Proud to be a Super User! Appreciate your Kudos 🙂
Feel free to email me with any of your BI needs.
- Mark as New
- Bookmark
- Subscribe
- Mute
- Subscribe to RSS Feed
- Permalink
- Report Inappropriate Content
hi, @AZL
You could get it by another way:
Step1:
Create a dim Rep table for slicer.
Step2:
Create two relationship between dim rep table and basic table by Current rep and New rep column(These two relationship must be inactive)
Step3:
Use USERELATIONSHIP Function to create two measure
Current Plan = CALCULATE(COUNTA('Table'[Product]),USERELATIONSHIP('Dim Rep'[Rep],'Table'[Current]))+0
New Plan = CALCULATE(COUNTA('Table'[Product]),USERELATIONSHIP('Dim Rep'[Rep],'Table'[New]))+0
Step4:
Now, drag Rep field from dim table and two measure into a table visual, and use Rep field from dim table for slicer/filter
and here is sample pbix, please try it.
Best Regards,
Lin
If this post helps, then please consider Accept it as the solution to help the other members find it more quickly.
- Mark as New
- Bookmark
- Subscribe
- Mute
- Subscribe to RSS Feed
- Permalink
- Report Inappropriate Content
@AZL solution attached, everything is done in edit query.
Subscribe to the @PowerBIHowTo YT channel for an upcoming video on List and Record functions in Power Query!!
Learn Power BI and Fabric - subscribe to our YT channel - Click here: @PowerBIHowTo
If my solution proved useful, I'd be delighted to receive Kudos. When you put effort into asking a question, it's equally thoughtful to acknowledge and give Kudos to the individual who helped you solve the problem. It's a small gesture that shows appreciation and encouragement! ❤
Did I answer your question? Mark my post as a solution. Proud to be a Super User! Appreciate your Kudos 🙂
Feel free to email me with any of your BI needs.
Helpful resources

Join our Fabric User Panel
Share feedback directly with Fabric product managers, participate in targeted research studies and influence the Fabric roadmap.

| User | Count |
|---|---|
| 63 | |
| 62 | |
| 42 | |
| 19 | |
| 16 |
| User | Count |
|---|---|
| 113 | |
| 105 | |
| 36 | |
| 28 | |
| 28 |


