Get certified for free when you join Fabric Data Days 2026 and dive into Fabric, Power BI, SQL, AI, and other essential data skills.
Join nowJuly 7 - July 17 | Round 2 of the Power BI Dataviz World Championships. Don't miss your chance! Learn more
I tried to pivot a table with aggregate function sum in python. After running python script in power bi I am not able to see index columns which i used to group by. But if I am trying to execute this code in python it's working perfectly by displaying index columns.
Here below my code;
import pandas as pd
pivotset = dataset.pivot_table(index=['movieID','user'], values=['Rating'], aggfunc='sum')
print(pivotset)
Result in Python is:
movieID user Rating
1 Ali 5
Ganesh 5
Jayaram 2
Kevin 1
Mithun 3
Musthafa 3
Shafi 4
2 Jack 5
Sasi 4
Suresh 3
But if I am trying to do same in power bi the index variables are not displaying. Please help to find this.
Rating
5
5
2
1
3
The input dataset csv is below
movieID,user,Rating
1,Ganesh,5
1,Mithun,3
2,Sasi,4
1,Musthafa,3
2,Suresh,3
1,Shafi,4
1,Kevin,1
2,Jack,5
1,Jayaram,2
1,Ali,5
Please help me to find why the index variables are disappearing in power bi
Solved! Go to Solution.
@Anonymous ,
Based on my test, I'm afraid power bi doesn't support index columns in pandas table. As a workaround, you can achieve the same result by using "Pivot" and "Unpivot" in power query.
Firstly click "movieID" and "user" column, click transform-> Pivot Columns, select "Rating" as value, sum as aggregation, you will achieve table like below:
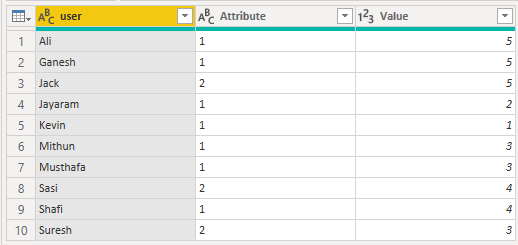
Secondly, click on column "1" and "2" then click "Unpivot Columns":
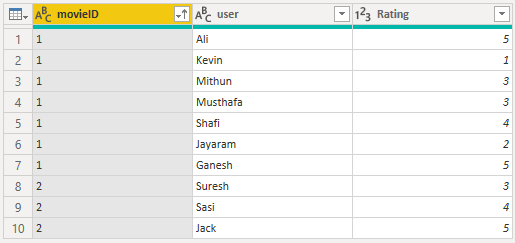
After reordering the columns and renaming the column headers, you will achieve the result:
Regards,
Jimmy Tao
Thank you Jimmy for the fast response and clarified answer. I will try the same then.
@Anonymous ,
Based on my test, I'm afraid power bi doesn't support index columns in pandas table. As a workaround, you can achieve the same result by using "Pivot" and "Unpivot" in power query.
Firstly click "movieID" and "user" column, click transform-> Pivot Columns, select "Rating" as value, sum as aggregation, you will achieve table like below:
Secondly, click on column "1" and "2" then click "Unpivot Columns":
After reordering the columns and renaming the column headers, you will achieve the result:
Regards,
Jimmy Tao
Join us in Barcelona for FabCon and SQLCon, the Fabric, Power BI, SQL, and AI community event. Save €200 with code FABCMTY200.
Join Data Days 2026: 60 days of free live/on-demand sessions, challenges, study groups, and certification opportunities.
| User | Count |
|---|---|
| 28 | |
| 23 | |
| 19 | |
| 18 | |
| 15 |
| User | Count |
|---|---|
| 47 | |
| 44 | |
| 43 | |
| 34 | |
| 30 |