This is best Fabric, Power BI, SQL and AI community event. How do we know? The last event sold out! Save €200 with code FABCMTY200.
Register nowThe Fabric community is upgrading! Read all of the details including the timeline and what you can expect. Learn more
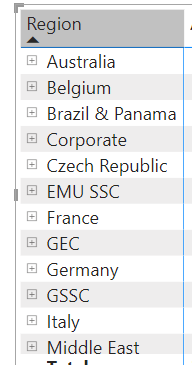
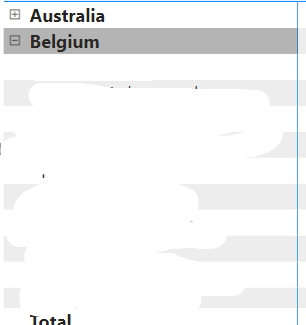
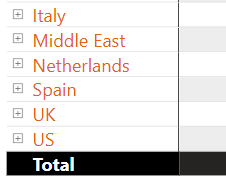
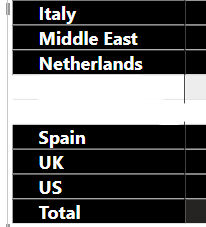
Is there a quick and easy way to turn off the new formatting that is automatically applied in matrix visuals: Row labels and values being automatically bolded and colors changing when rows with multiple values are expanded? A few examples of what I'm talking about. The firs ttwo are the same table, with all top row labels and values automatically being bold when I expand 'Belgium'. The 3rd and 4th are the same visual as well where the background and font colors for the row labels is automatically changed when I expand 'Netherlands'.
Solved! Go to Solution.
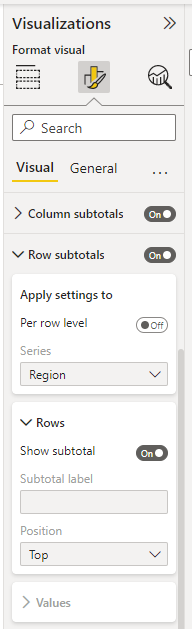
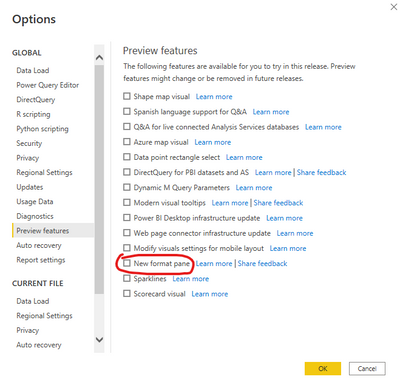
What version of BI Desktop are you using? I can no longer do that in the current version I just installed which is driving me so crazy, see snip below. Am I missing something?
Hi @mterry ,
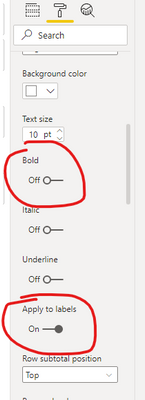
You could diable these options, for example Bold, under Format ->Row subtotals, Grand total and Field formatting.
Best Regards,
Jay
What version of BI Desktop are you using? I can no longer do that in the current version I just installed which is driving me so crazy, see snip below. Am I missing something?
Ok thanks, I did as you said but then also had to ensure that I applied it to labels. Thanks for the help
Join us in Barcelona for FabCon and SQLCon, the Fabric, Power BI, SQL, and AI community event. Save €200 with code FABCMTY200.
| User | Count |
|---|---|
| 24 | |
| 22 | |
| 20 | |
| 18 | |
| 14 |
| User | Count |
|---|---|
| 27 | |
| 21 | |
| 21 | |
| 20 | |
| 20 |